
Integrating the IQM into Philips Pinnacle 9.8
Step 1: Comparison of measured data
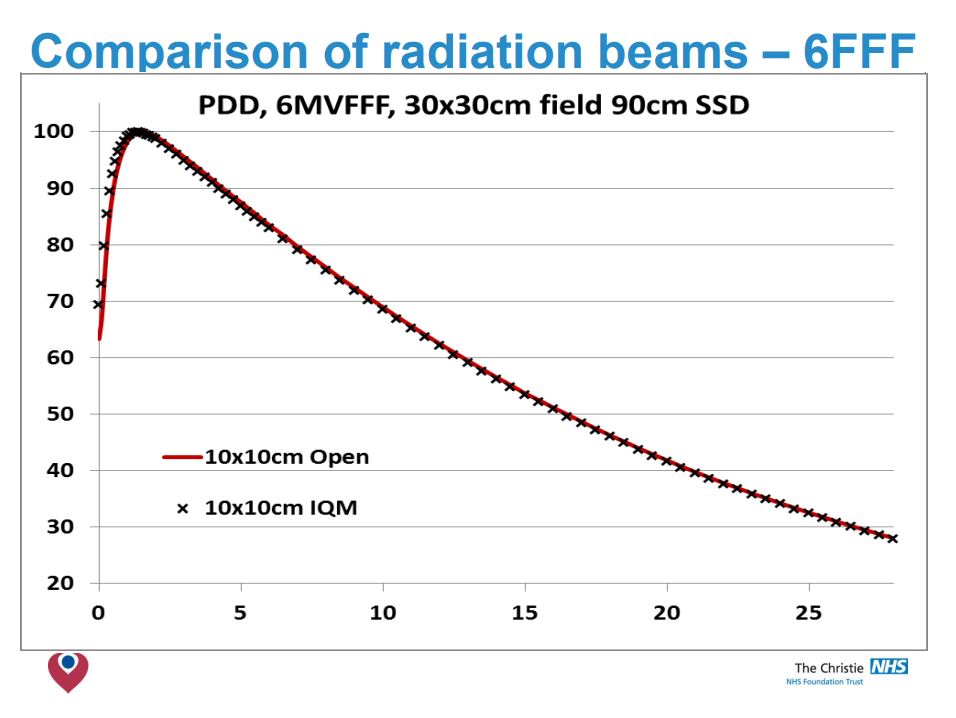
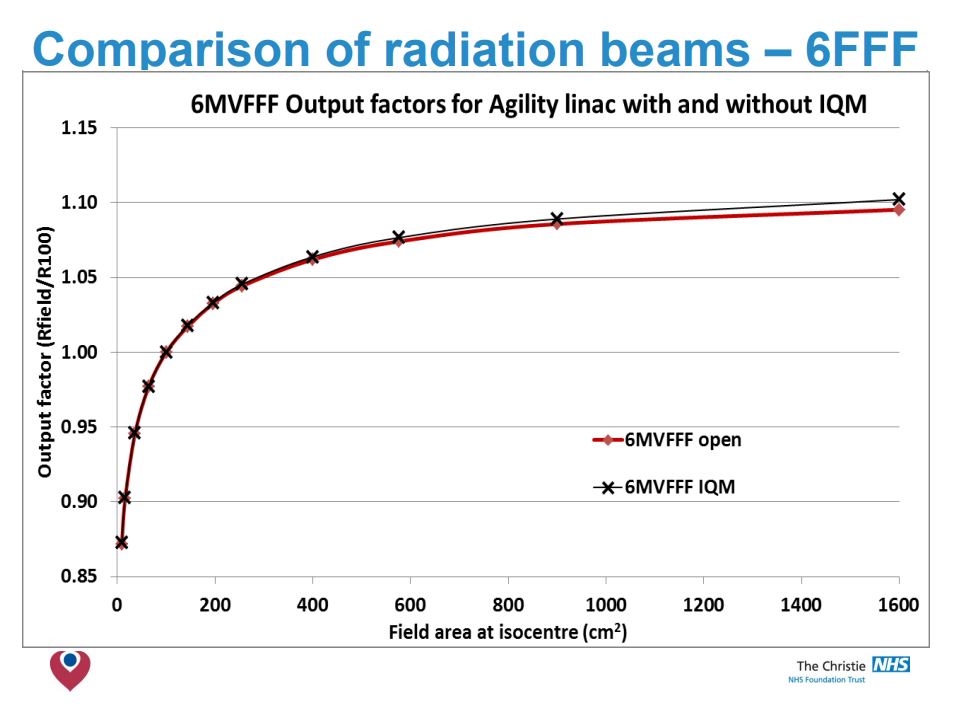
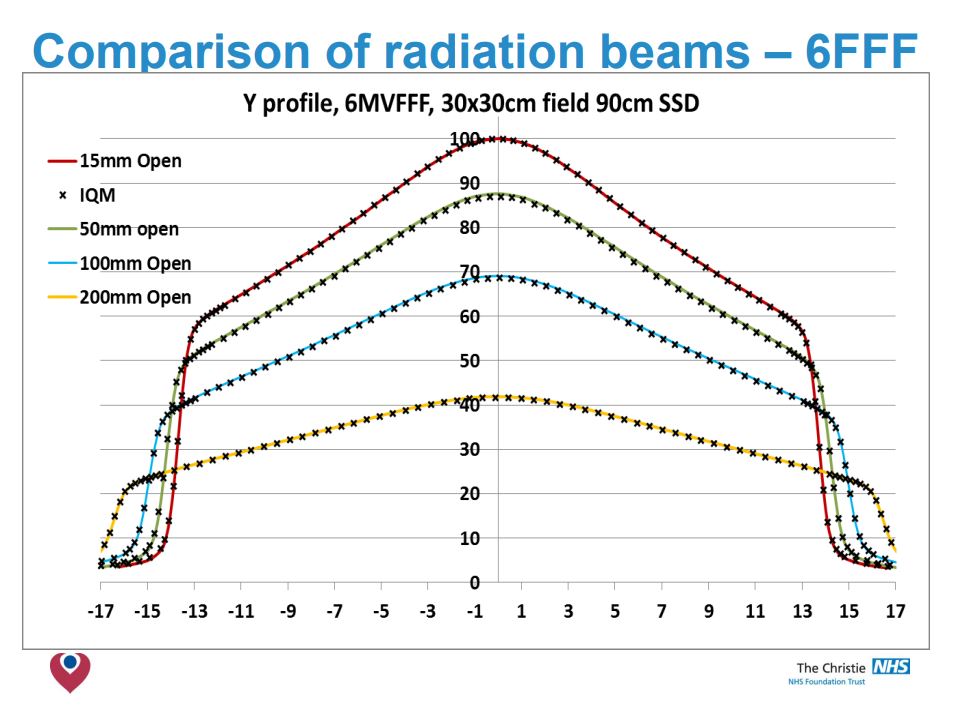
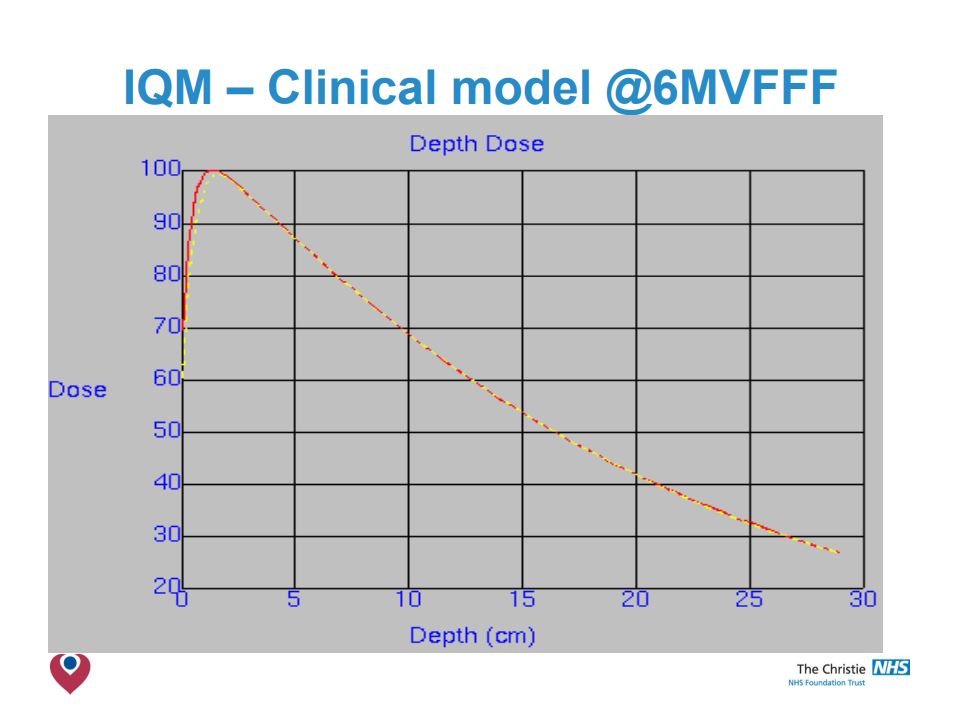
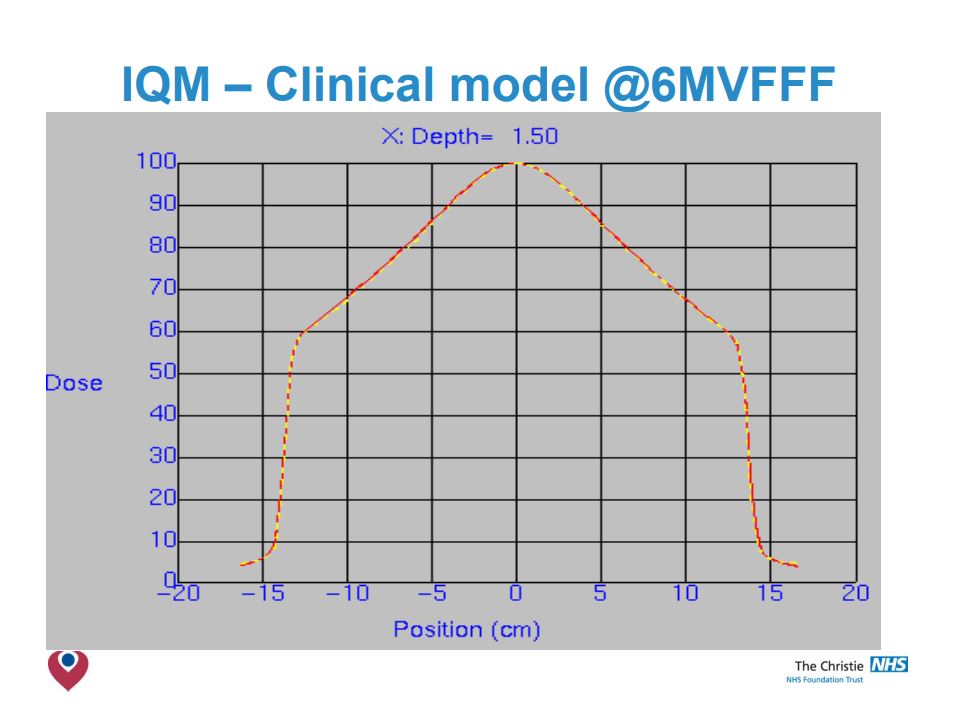
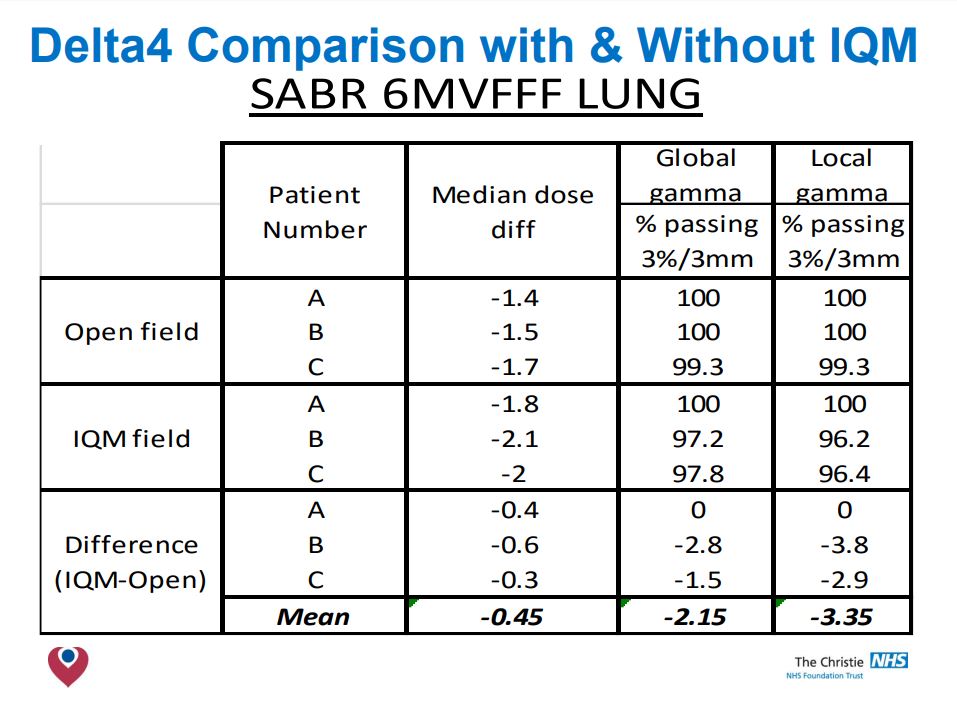
Comparison of data measured with & without IQM in plotting tank (6, 10 & 6FFF).

Conclusion
- No significant differences in O/P factors was detected.
- The beam attenuation is found to be a fixed amount for each energy.
- IQM has little effect on PDD beyond Dmax or on profiles <20x20cm.
- For 6 & 10 MV modelling at larger radial distances needed review.
Step2: Comparison with existing clinical models
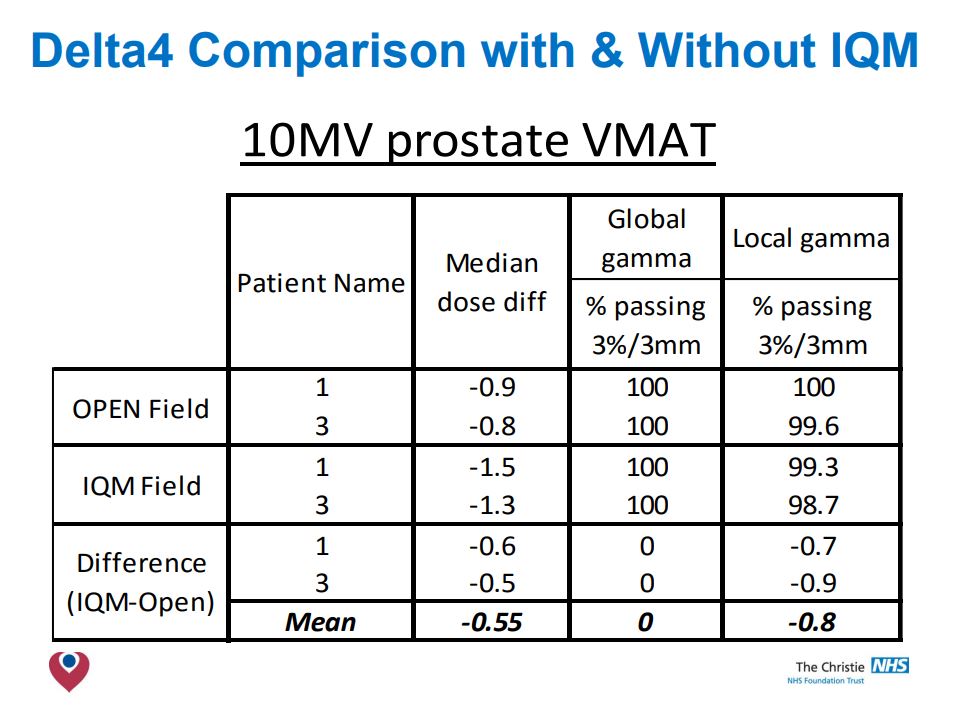
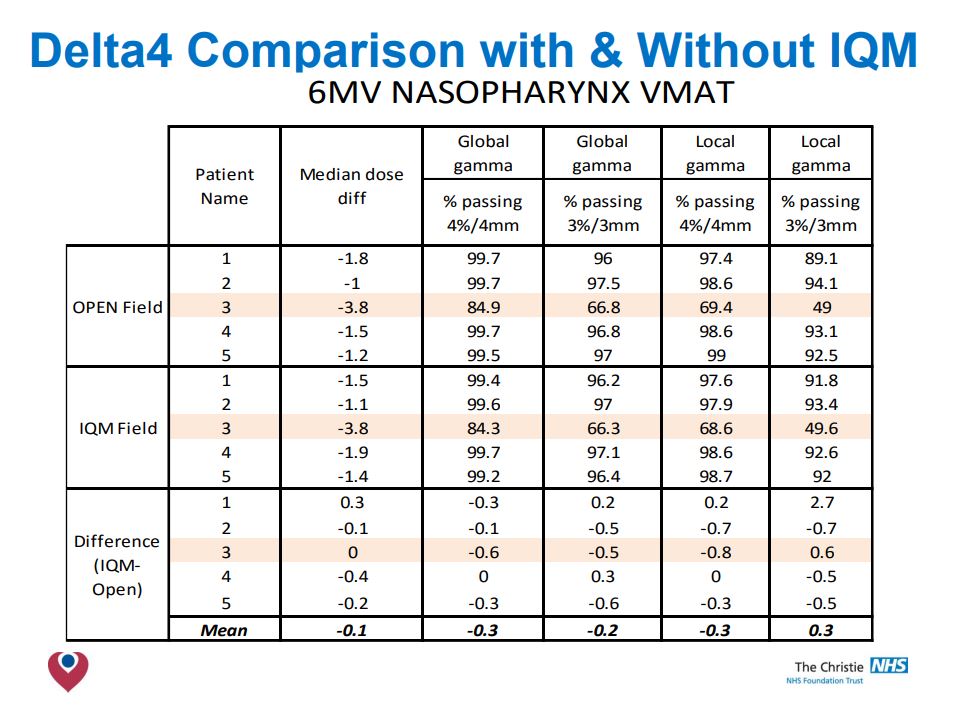
Step3: Initial validation
Conclusions
- The build up region is modified by the presence of the IQM, reducing ‘skin sparing’.
- Smaller field PDDs & Profiles are not affected by IQM.
- Larger fields have shoulders drop, more notably at shallower depths.
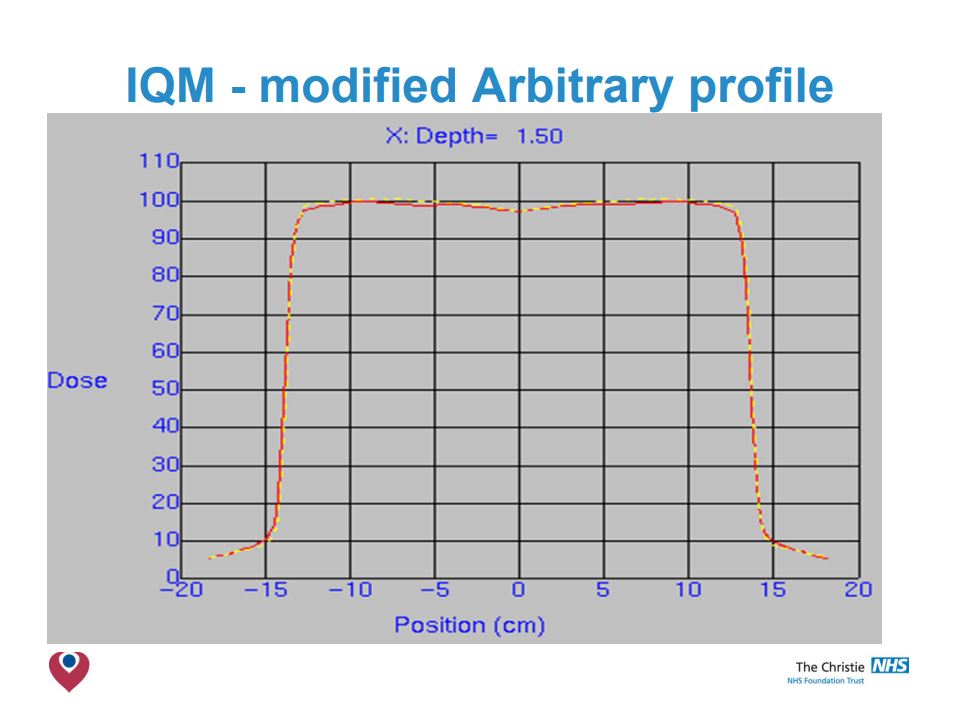
- Adjustment of arbitrary fluence profile improved agreement – but not observable clinical benefit.
- Clinical models acceptable at 6MV & 10MV.
- Simple correction factor to change MUs was all that was required in Pinnacle 9.8.
- Validation of your clinical models necessary when integrating the IQM into your planning system, but modifications are likely to be small.
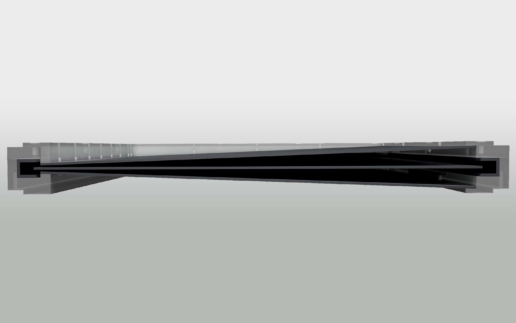
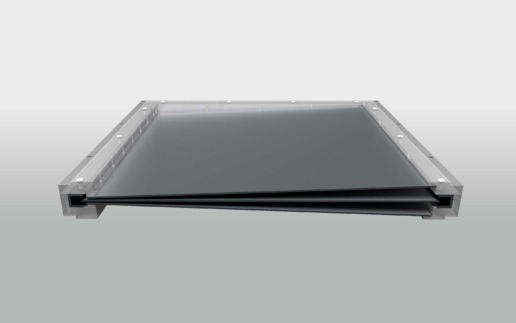
The Transmission Factor
of the IQM Detector
Test purpose
The influence of the IQM transmission detector on photon beam properties was evaluated in a pre-clinical phase, using data from nine participating centers. The beam attenuation due to IQM was measured and the dependence of the transmission factors on beam energy and field size was investigated.
Test method
The transmission factor was calculated by means of measured absorbed dose at 10 cm depth for all available energies and field sizes.
Test results
The mean transmission factors of the IQM detector showed statistically significant energy dependence for all investigated flattened and FFF beams. It ranged from 0.9412 to 0.9589 for standard beams 6 MV to 18 MV, while for 6 MV FFF and 10 MV FFF beams it was 0.9440 and 0.9533, respectively. While it might be argued that transmission factors close to 1 are preferable, the authors emphasize that every transmission factor has to be adequately incorporated into the TPS. On the other hand, variations in the range of 2% or more of the transmission factors versus field size can be considered as a shortcoming for the straightforward use within TPS. In that case no single value can be recommended and a new beam model needs to be introduced to the TPS. The maximal dispersion of the aggregated measurements from all participating centres and for all
field sizes from 1 cm × 1 cm to 20 cm × 20 cm was less than 0.49%, with a maximal cumulative uncertainty of 0.58%.
Conclusion
The transmission factors calculated for the attenuation due to the presence of IQM show energy dependence but only weak dependence on field size, with the maximum dispersion of measurements to be < 0.5% across 9 treatment machines, 6 energies and 9 field sizes.
The mean transmission factors of the IQM detector can be used either as tray factors within TPS for the particular linear accelerator energies or alternatively as modified outputs for the respective beam energies.
Influence of the IQM Detector on the surface dose
Test purpose
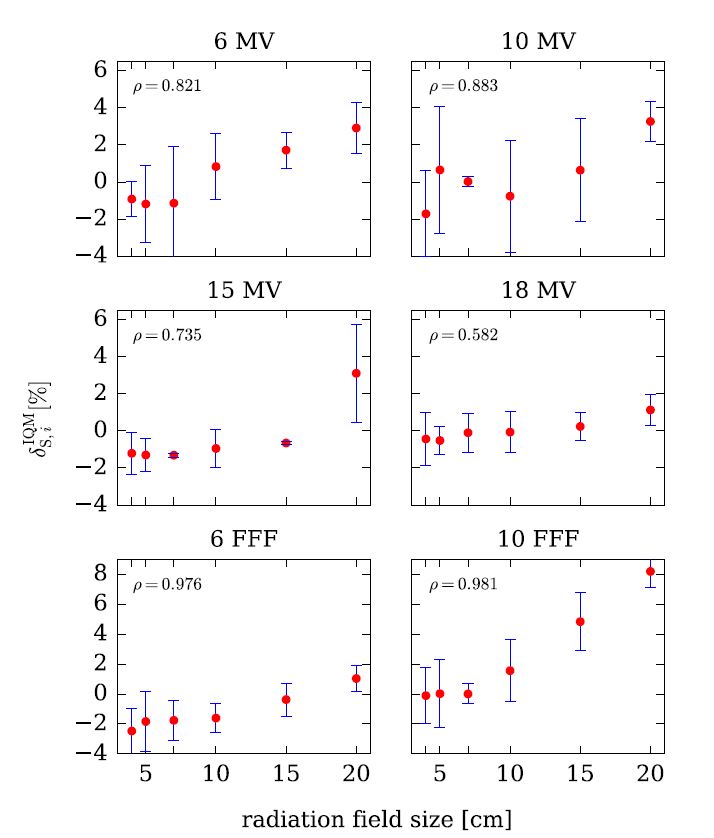
The influence of the Integral Quality Monitor (IQM) transmission detector on the surface dose was evaluated using data from nine participating centers.
Test method
The change in surface dose with/without IQM was assessed for all available energies (4 standard, 2 FFF) and field sizes from 4 cm × 4 cm to 20 cm × 20 cm.
Test results
Pearson’s product–moment correlation coefficient ρ indicates a positive linear correlation between surface dose and the radiation field size for all studied flattened and unflattened beams, however, except for the 20 cm x 20 cm field size for the 10 MV FFF beam, the change in surface dose did not exceed 3.3%.
Conclusion
This study demonstrates clinically negligible changes in the surface dose for all investigated beams. A modest increase of surface dose when IQM is in the beam path can be considered acceptable and not a limiting factor for its clinical use.
Therefore, the time needed to implement the IQM system can be shortened since no additional commissioning beyond taking the beam attenuation into account (as a transmission factor or modified output factor) is needed regarding beam properties such as beam hardening and surface dose.
Influence of the IQM Detector on the beam quality
Test purpose
The influence of the Integral Quality Monitor (IQM) transmission detector on the beam quality (beam hardening) was evaluated using data from nine
participating centres.
Test method
For 6 different nominal photon energies (4 standard, 2 FFF) and square field sizes from 1 cm × 1 cm to 20 cm × 20 cm, the effect of IQM on beam quality was assessed from the PDD20,10 values obtained from the percentage dose depth (PDD) curves, measured with and without IQM in the beam path.
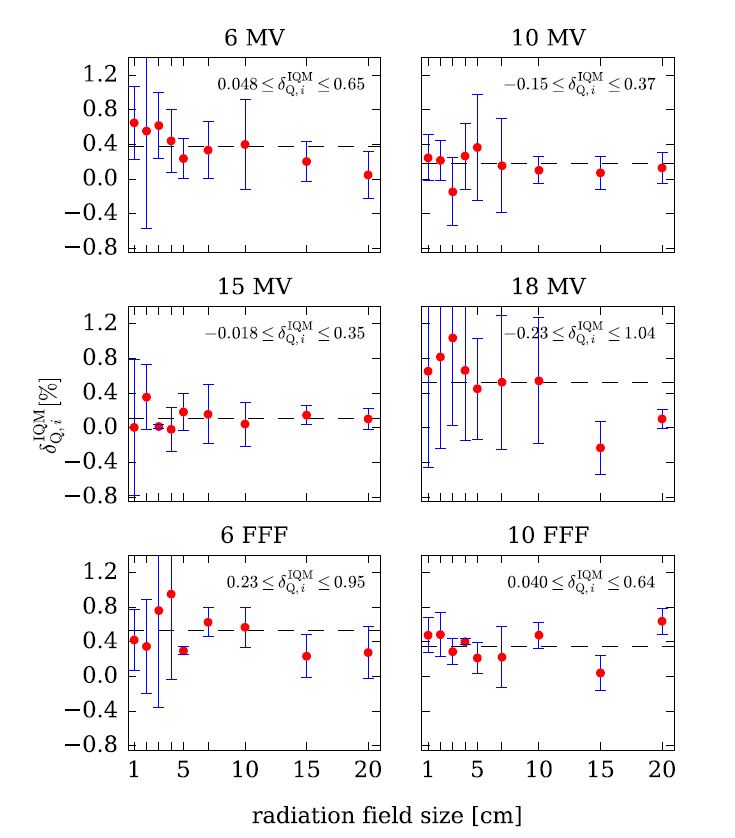
Test results
The presence of IQM caused a small but measurable and statistically significant beam hardening effect. Beam hardening was most pronounced for the 6 MV FFF beam where it increased to 0.53%. Statistical significance of the beam hardening effect was demonstrated (p < 0.01) for all investigated beams except for 15 MV where no statistically
significant difference was found.
Conclusion
As beam quality changes were always lower than 0.53%, our conclusion is that this effect has no considerable clinical relevance.
This study demonstrates clinically negligible changes in beam quality for all investigated beams. Therefore, the time needed to implement the IQM system can be shortened since no additional commissioning is
needed regarding this beam property.
The Beam Attenuation
of the IQM Detector
Test method
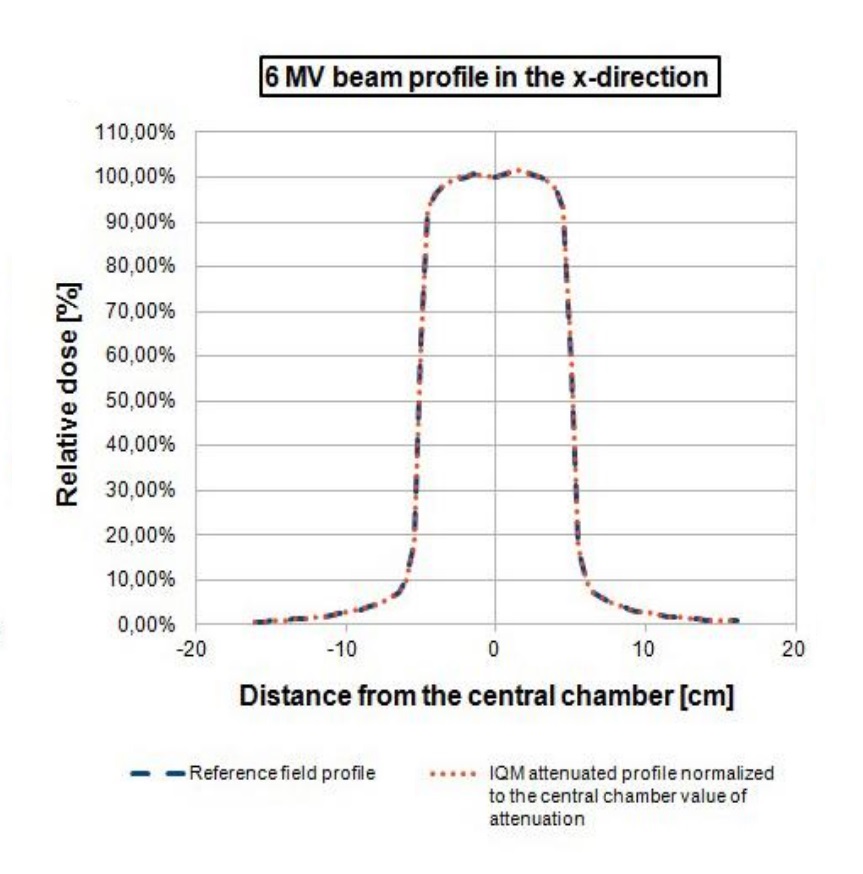
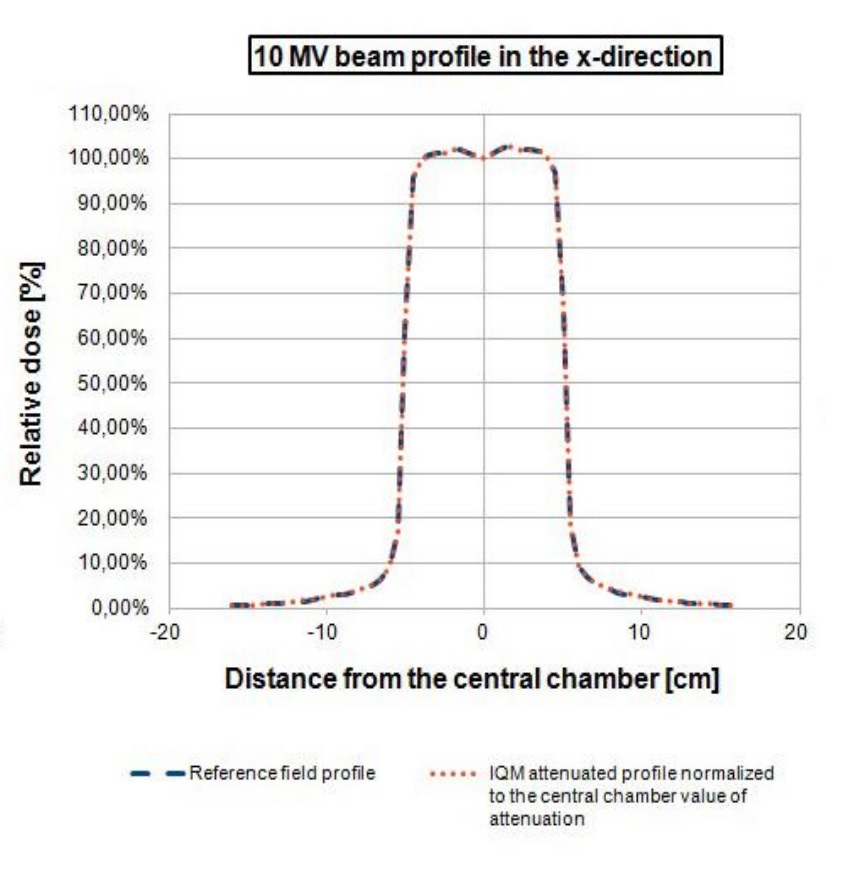
Beam attenuation was calculated at 4 different beam sizes (from 5 cm x 5 cm to 20cm x 20 cm) by the IC Profiler (Sun Nuclear Corp.) at 6 MV and 10 MV beam energies in both X and Y directions.
Test results
Beam attenuations were normalized to the central chamber of the IC Profiler. The average attenuation value was 6.56% ± 0.03% and 5.27% ± 0.12% for 6 MV and 10 MV beams, respectively. Flatness deviation is < 0.4 % for 6 MV and < 0.1 % for 10 MV excluding the beam penumbra regions. The beam profiles in the X direction for a 10 cm x 10 cm field are depicted in Figure 2 for 6 MV (Figure 2a) and 10 MV (Figure 2b) beams. The reference field profile (blue line) is plotted with the IQM attenuated field normalized to the central chamber attenuation value (orange line).
Conclusion
IQM beam attenuation can be considered to be homogeneous in both X and Y directions and the machine-specific beam attenuation percentage could be used to rescale treatment plan dose for clinical IQM use.