Test purpose
The aim of this multi-centre study was to test the ability of the system to detect small delivery errors in IMRT plans. Initial tests demonstrated the IQM system’s reproducibility and ability to detect the small errors introduced into IMRT plans. This test examined how the signal deviations detected by the IQM system for these small, induced errors correlate with variation in other commonly employed metrics for evaluating calculated and delivered dose distributions, such as the γ passing rate and DVH variations.
Test method
Seven types of errors were induced in 9 clinical step-and-shoot IMRT plans, by modifying the number of MUs and introducing small deviations in leaf positions. The original and modified plans were delivered and the detector signal variations were recorded. Calculated dose distributions were compared in terms of Gamma (γ) passing rates and Dose Volume Histogram (DVH) metrics (for several significant DVH parameters). The correlation between detector signal variations, γ passing rates and DVH parameters was investigated.
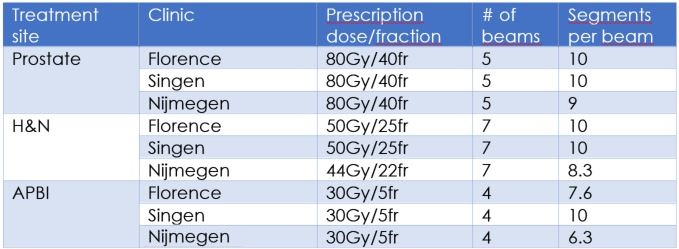
3 patients were selected for each of 3 anatomical sites, from which 24 plans for each anatomical site were generated: 3 “error free” (EF) plans (1 plan per patient) and 21 “error induced” (EI) plans (7 plans per patient). In total 72 plans were delivered and measured with the IQM system. For each EI plan delivery the IQM signal variations were recorded and the percentage variation with respect to the original EF plan delivery recorded signals was calculated.
For each EI plan, Gamma analysis (γ) was performed comparing the EI and EF dose distributions, and repeated with three levels of passing criteria: 3%/3mm, 2%/2mm and 1%/1mm. The correlation between γ pass rates and IQM signal variation was investigated.
For each EI plan, DVH analysis was performed comparing the EI and EF dose distributions. The variations in several clinically relevant DVH parameters were evaluated for both PTVs and OARs. For PTVs, near maximum dose (D1%), D95% and V95% were recorded. The correlation between DVH parameter variation and IQM signal variation was investigated.
Test results
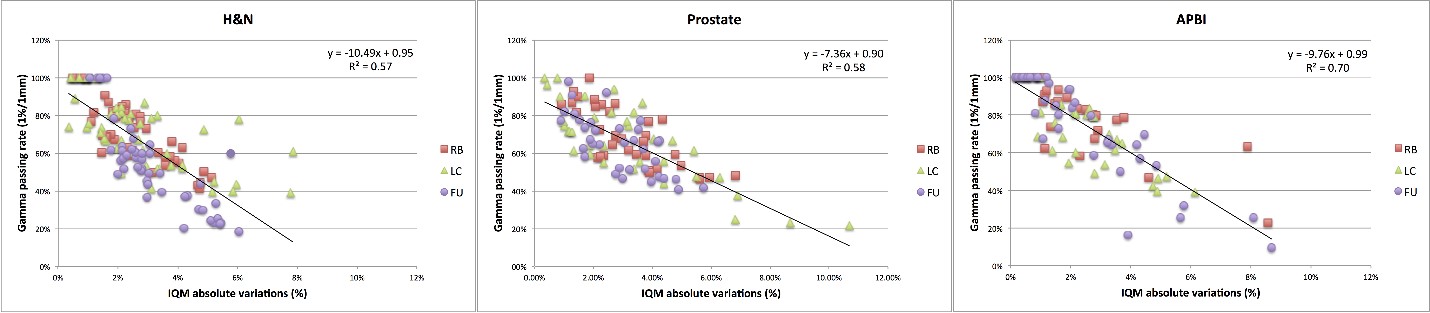
In the γ analysis, the induced errors were detected (passing rate < 100%) in a relatively low percentage of beams when the 3%/3mm and 2%/2mm criteria were applied. For the 3%/3mm criteria, the error detection percentages were: 58% for H&N, 36% for prostate and 29% for APBI. For the 2%/2mm criteria, the error detection percentages were 69% for H&N, 51% for prostate and 58% for APBI. Only for the 1%/1mm criteria were errors detected in the wide majority of beams (86% for H&N, 97% for prostate and 82% for APBI).
The following graph shows the γ passing rate (1%/1mm) as a function of the IQM percentage variation for each delivered beam of the H&N (a), prostate (b) and APBI (c) plans. As can be observed from the r2 values, the correlation between the γ passing rate (1%/1mm) and the IQM signal variation is moderate.
The next graph shows the correlation between PTV D95% and IQM signal variation for each treatment site, then the data for the 3 different sites plotted and fitted together.
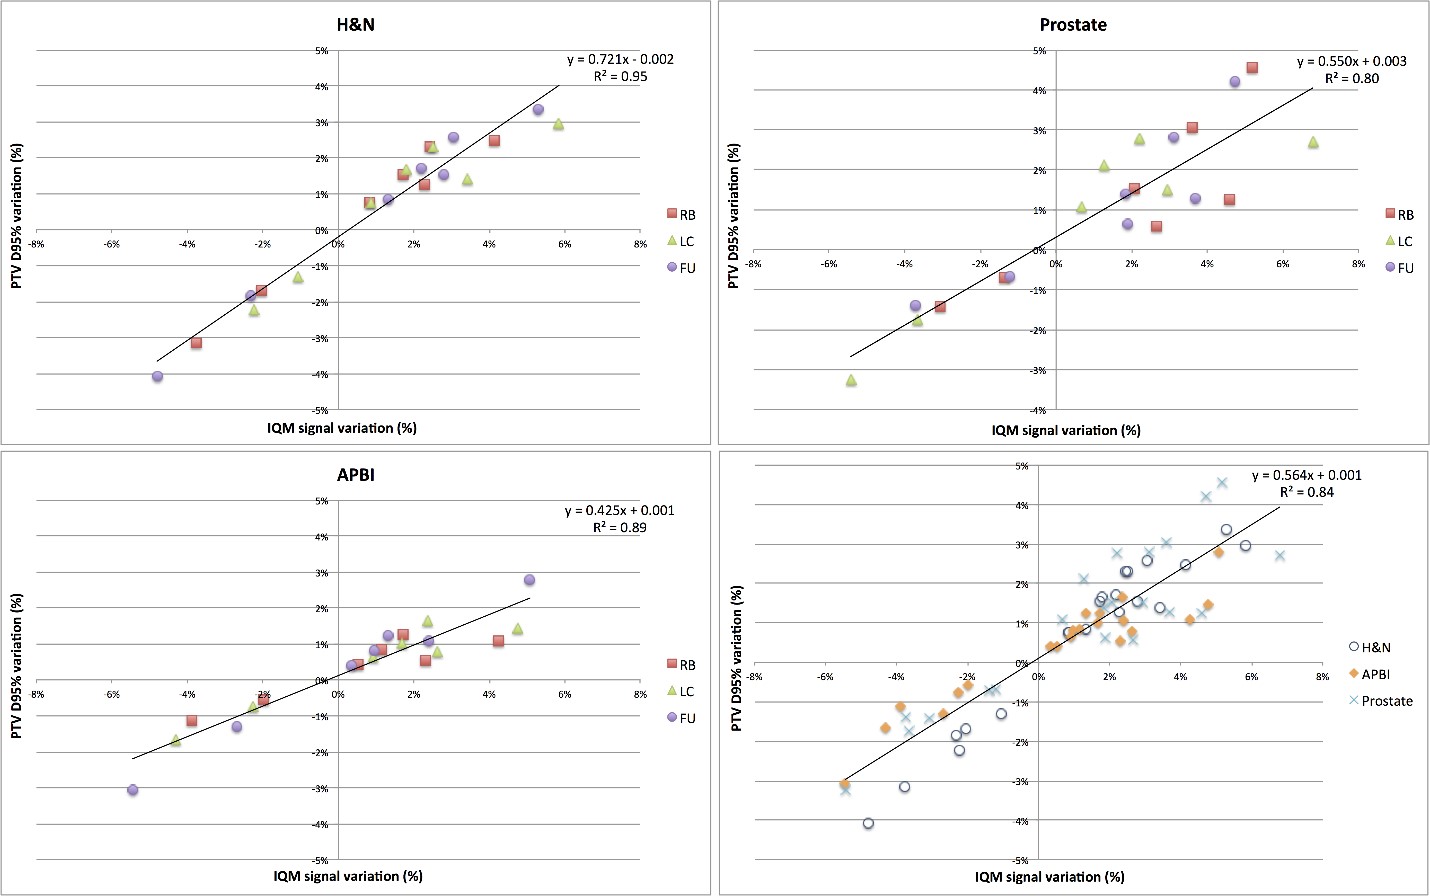
A good correlation exists between PTV D95% variation and IQM signal variation, independent of treatment site.
The following graph shows correlations between selected DVH OAR parameters and IQM signal variations.
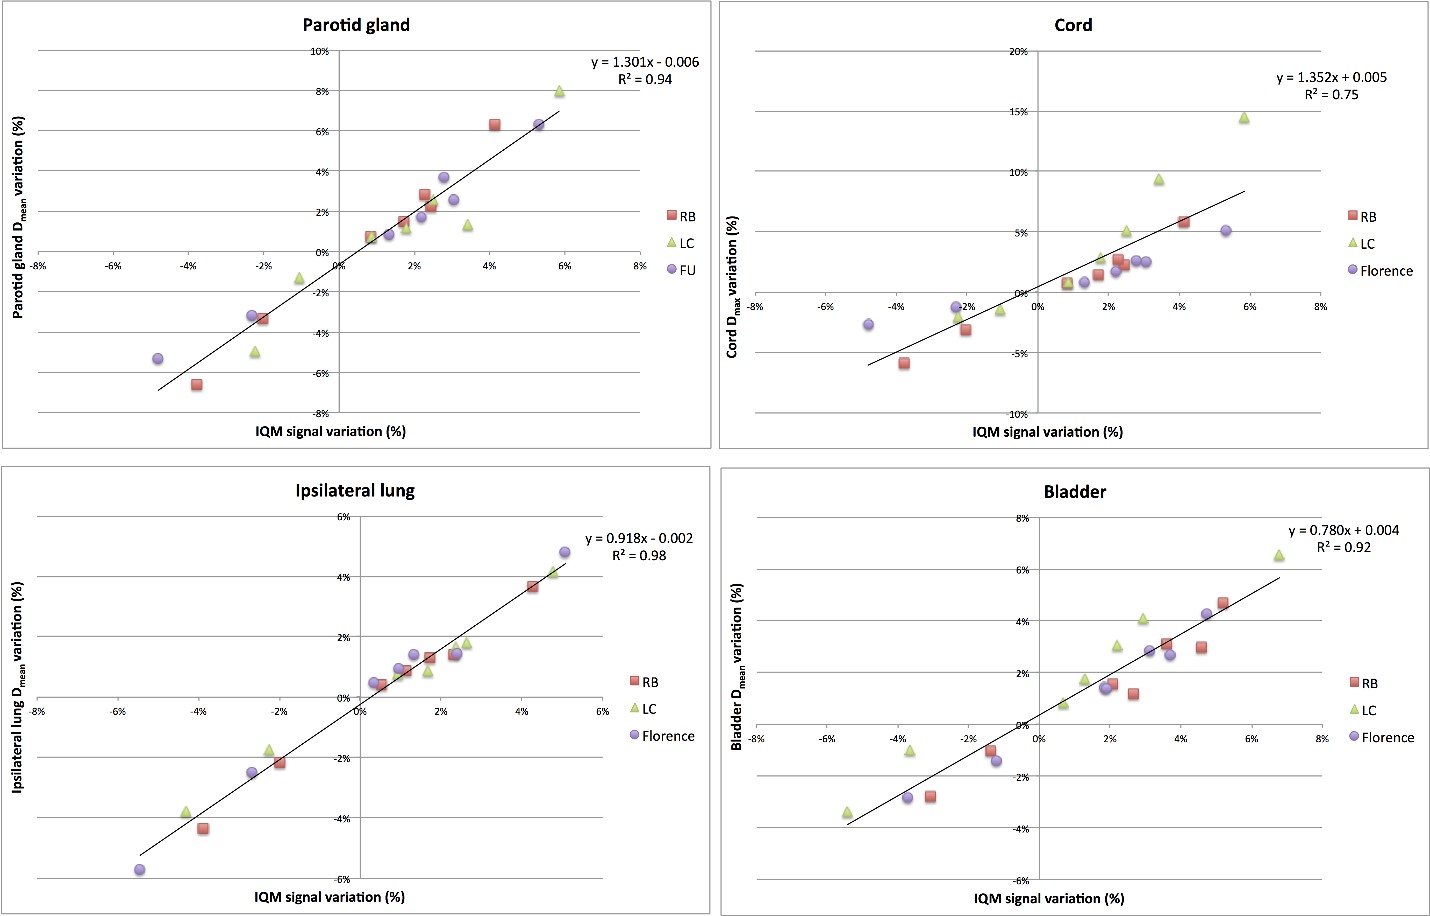
As can be observed by the correlation indices, PTV D95% and OAR’s Dmean are the DVH parameters expressing the best correlations with IQM signal variations. The data collected in the different centres were consistent, indicating a robust IQM performance.
The study found a good correlation between IQM signal variation, PTV D95% and several OAR parameter variations (especially Dmean) for the different treatment sites examined. Moreover, data collected in different centres, using different equipment and potentially different planning approaches, are consistent, demonstrating the robustness of the correlations found. This correlation makes it possible to identify DVH variation limits (associated with negligible or no clinical impact) for each individual patient and deriving corresponding IQM signal deviation tolerances.
Conclusion
This test demonstrated the IQM system’s clear and consistent correlation with DVH metrics. The larger multi-centre study found that the IQM system is capable of detecting small delivery errors in MU and leaf position and shows a high sensitivity for clinical practice.