Evaluating beam attenuationAzienda Provinciale per i Servizi Sanitari, Trento, Italy
Beam attenuation was calculated for 4 different field sizes (from 5×5 to 20×20 cm2 ) based on IC Profiler (Sun Nuclear Corp.) measurements
in both X and Y directions for 6 MV and 10 MV beam energies
Beam attenuations were normalized to the central chamber of IC Profiler.
It gives average attenuation values of 6.56 % ± 0.03 % and 5.27 % ± 0.12% for 6 MV and 10 MV beams, respectively.
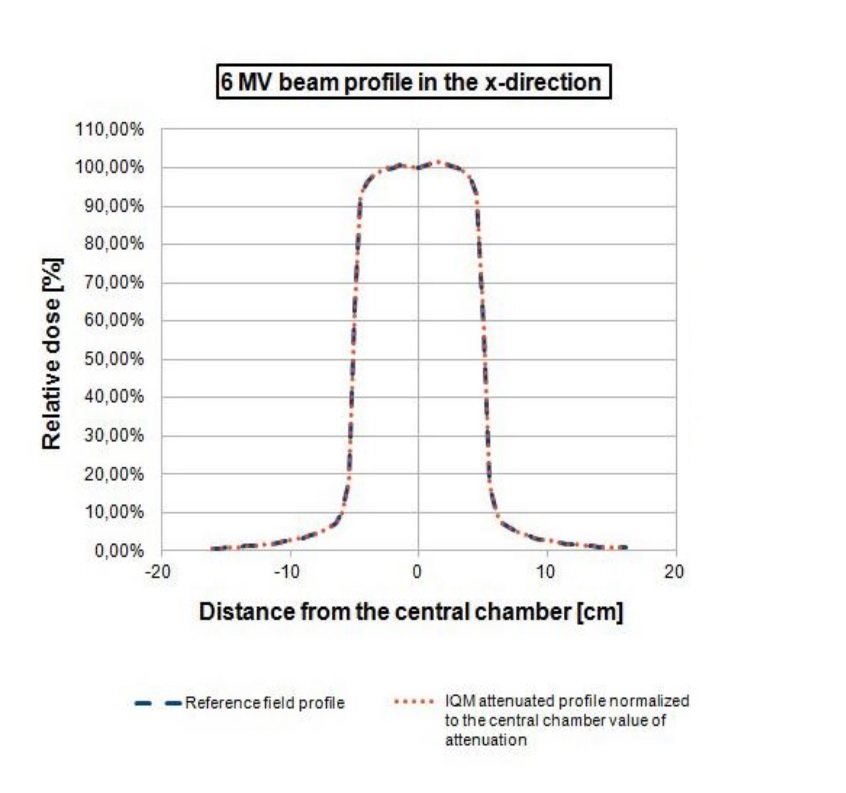
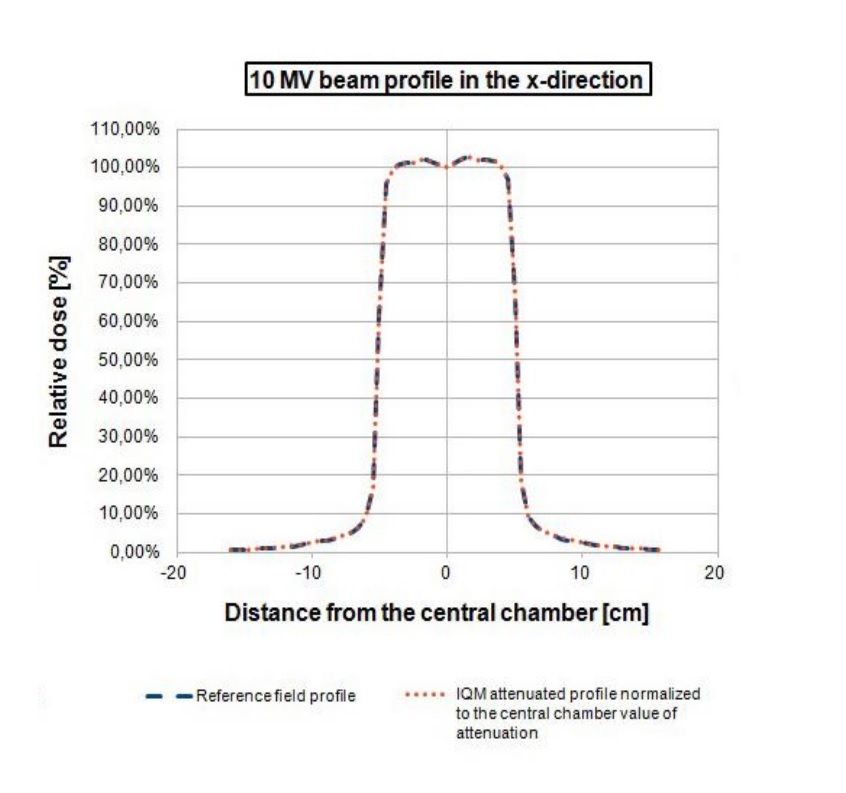
Flatness deviation is < 0.4 % for 6 MV and < 0.1 % for 10 MV excluding beam penumbra regions.
The beam profiles in the X direction for a 10×10 cm2 field are depicted in Figure 2 for 6 MV ( Figure 2a) and 10 MV ( Figure 2b) beams.
The reference field profile (blue line) is plotted with the IQM attenuated field normalized to the central chamber attenuation value (orange line).
IQM beam attenuation is considered to be homogenous in both X and Y directions and the machine-specific beam attenuation percentage could be used to rescale the treatment plan dose for clinically IQM use.
Conclusion
The machine-specific beam attenuation percentage could be used to rescale the treatment plan dose for clinically IQM use.
Error detection capability compared to Scandidos Delta 4(Radboud UMC, Nijmengen, The Netherlands)

Various IMRT and VMAT clinical beams with induced errors: One segment/control point retraction of leaves by 10, 5 and 2mm and one segment increase of 10, 5 or 2MU
Sensitivity and specificity can be expected to be sufficient for clinical practice, and at least equal to the Scandidos Delta 4
Sensitivity and specificity can be expected to be sufficient for clinical practice, and at least equal to the Scandidos Delta 4
Simulated errors(University of Florence, Italy)
Errors were introduced to an H&N IMRT treatment composed by seven beams (gantry angles = 0°, 40°, 80°, 140°, 220°, 280°, 320°). Errors were introduced by modifying the number of delivered MU (between 1 and 3 ) and by introducing small deviations in leaf positions for each segment of each beam (mimicking an MLC bank error).
I am text block. Click edit button to change this text. Lorem ipsum dolor sit amet, consectetur adipiscing elit. Ut elit tellus, luctus nec ullamcorper mattis, pulvinar dapibus leo.
I am text block. Click edit button to change this text. Lorem ipsum dolor sit amet, consectetur adipiscing elit. Ut elit tellus, luctus nec ullamcorper mattis, pulvinar dapibus leo.
Error detection capability compared to PTW Octavius(Azienda Provinciale per i Servizi Sanitari, Trento, Italy)
The IQM capability in recognizing errors was performed introducing deviations in 4 clinical H&N VMAT plans: 3, 5 and 10% errors on total delivered MUs and 3, 5 and 10mm MLCs shift by means of an homemade Matlab(MathWorks, Natick, MA) script. The cumulative IQM checksum value was measured and the percentage difference was calculated with respect to the non-modified plan. At the same time they obtained dose distribution maps through the PTW 2D array inserted in a rotating QA phantom (RT-smartIMRT, dose.point GmbH). The local gamma pass rates (2%/2mm) were compared to the original plan values.
I am text block. Click edit button to change this text. Lorem ipsum dolor sit amet, consectetur adipiscing elit. Ut elit tellus, luctus nec ullamcorper mattis, pulvinar dapibus leo.
I am text block. Click edit button to change this text. Lorem ipsum dolor sit amet, consectetur adipiscing elit. Ut elit tellus, luctus nec ullamcorper mattis, pulvinar dapibus leo.
Both methods detect specifically MLC shift errors, while MUs variations were better identified by IQM. IQM shows a linear response with dose (R2=0.9995), while gamma analysis seems to have difficulty in identifying 3% and 5% MUs variations.