Correlation between IQM Signal, Gamma Index and Dose-Volume-HistogramAOU Careggi Florence, University of Florence
Do changes in IQM signal correlate with other metrics, such as the Gamma passing rate and DVH Variations when introducing a small delivery error?
Treatment delivery error #1: Dose
changes of 1MU, 2Mu and 3MU per beam
introducing dose changes of
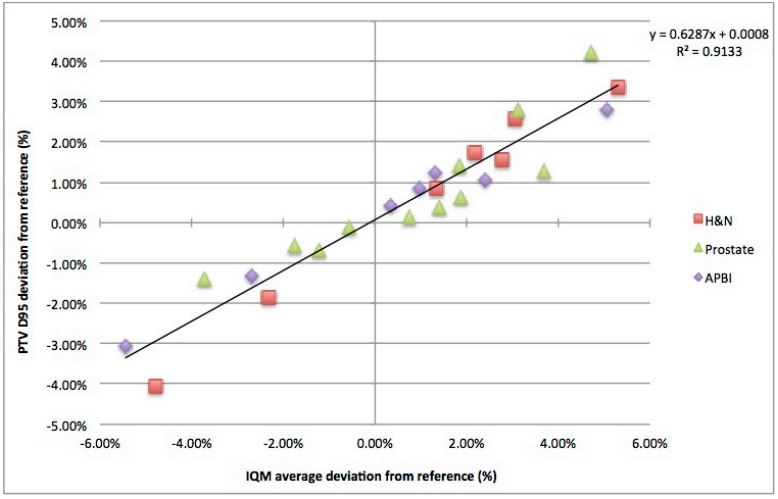
0.8% – 2.5% for H&N plan, 1.4% – 4.2% for Prostate plan and 0.4% – 1.3% for APBI plan.
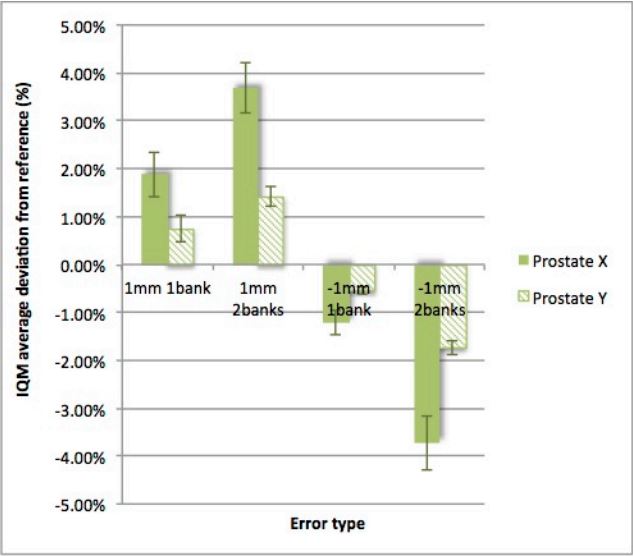
Treatment delivery error #2: Geometry
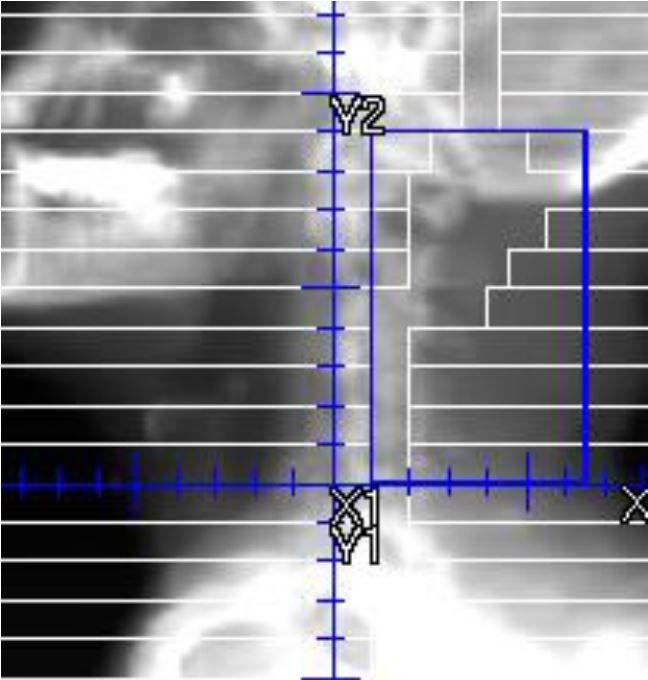
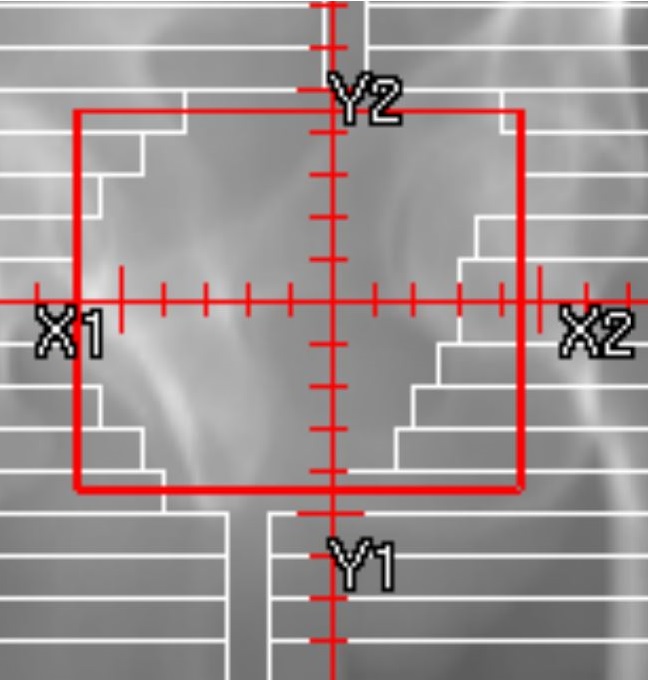
changes of 1mm in leaf bank positions
single bank shift by 1mm and beam position shift by 1mm
Results
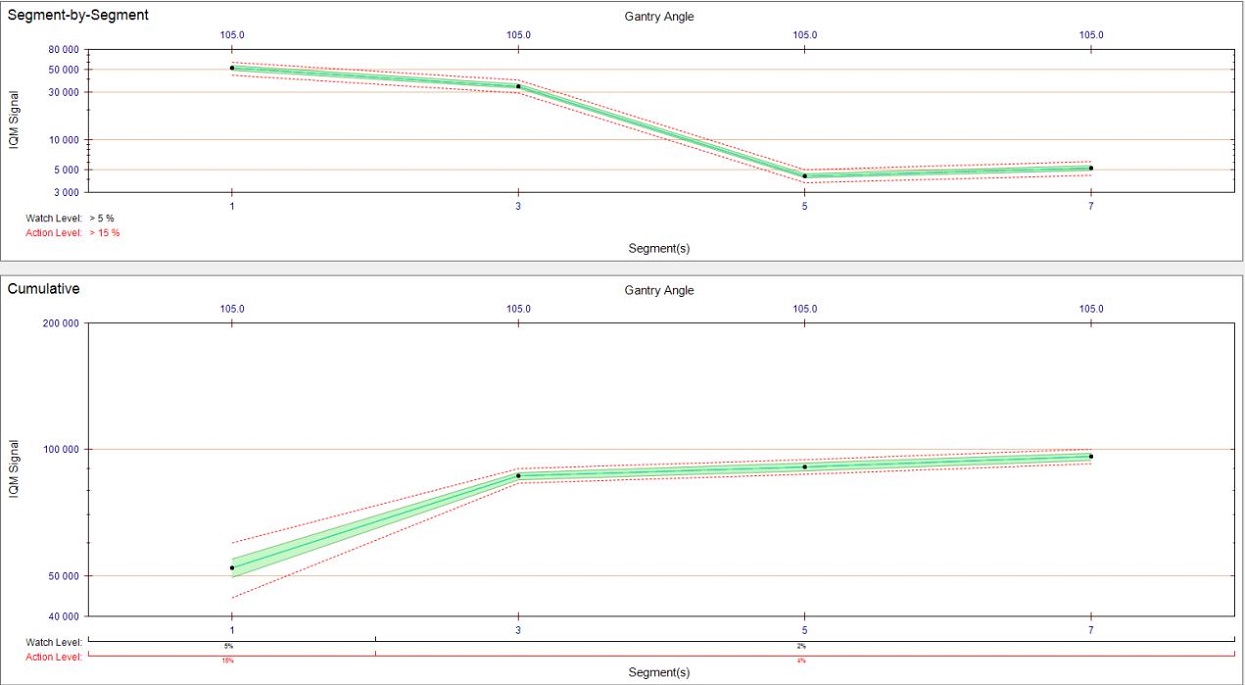
IQM Sensitivity for small treatment delivery errors
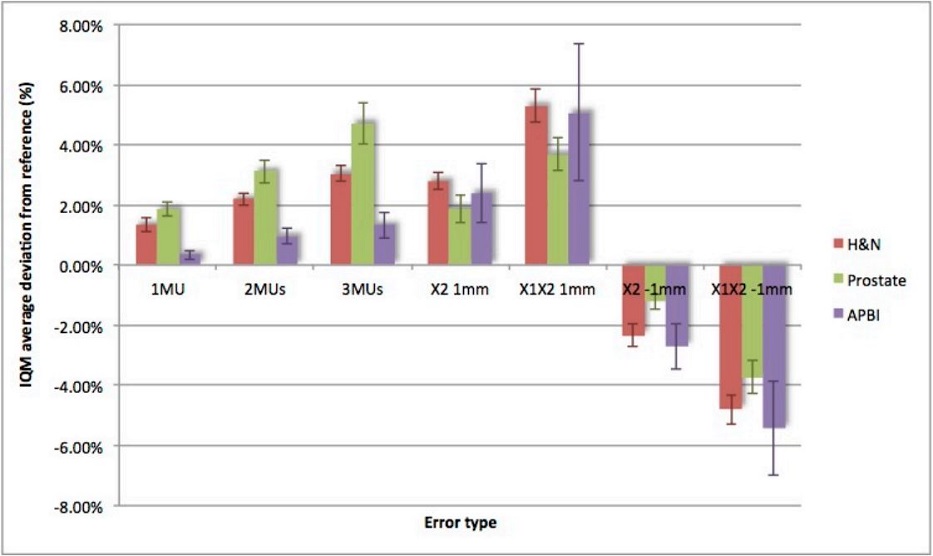
IQM is able to detect all treatment delivery errors
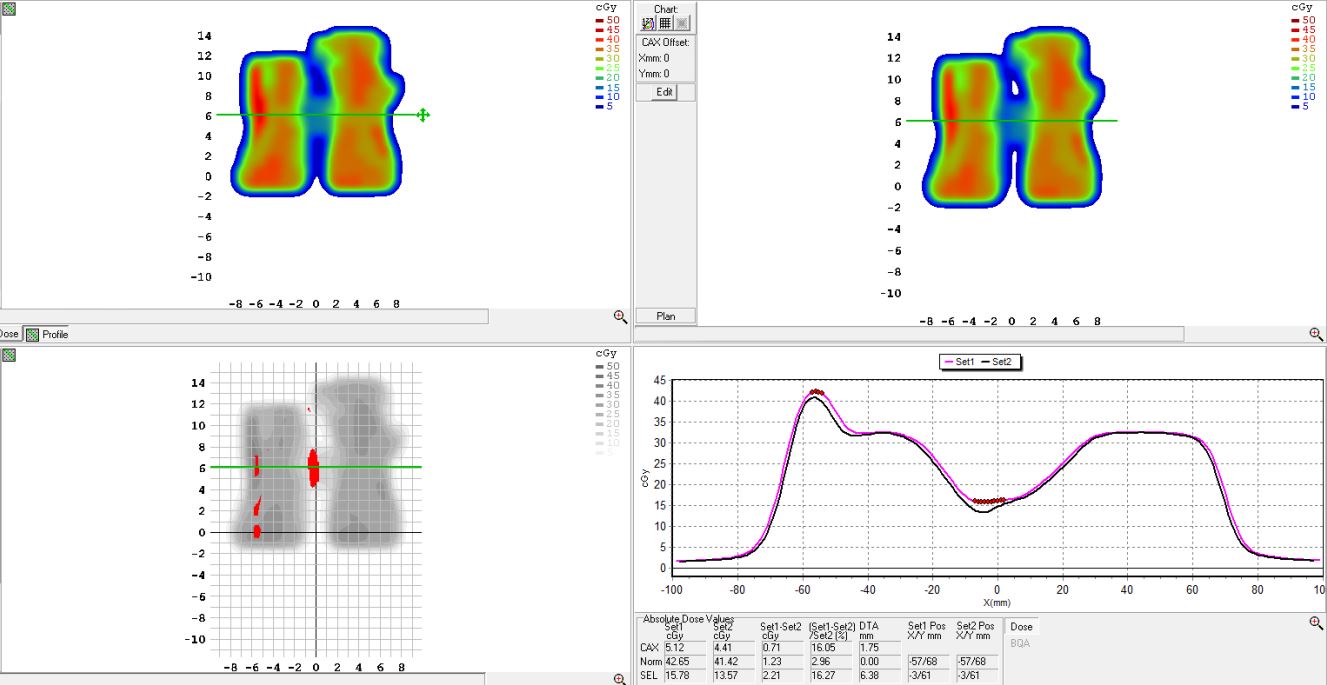
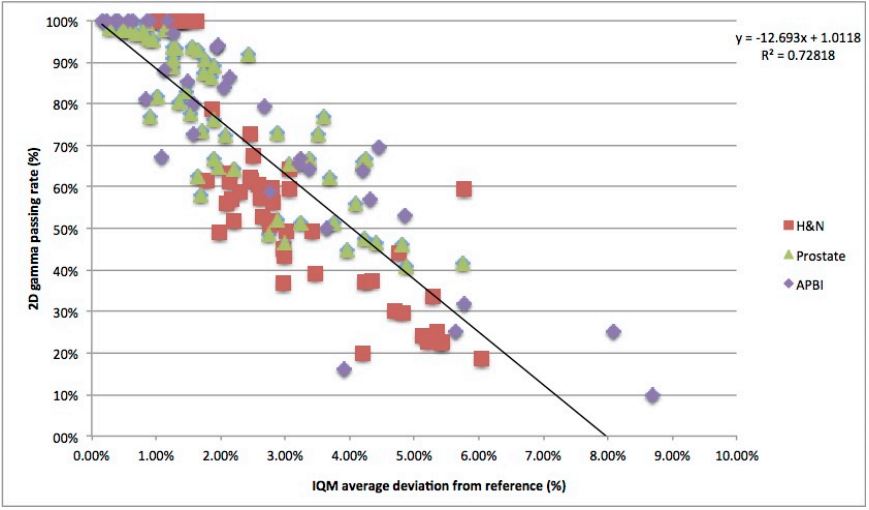
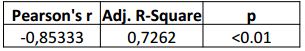
IQM signal correlation with 2D Gamma (1%/1mm, 10%, local approach)
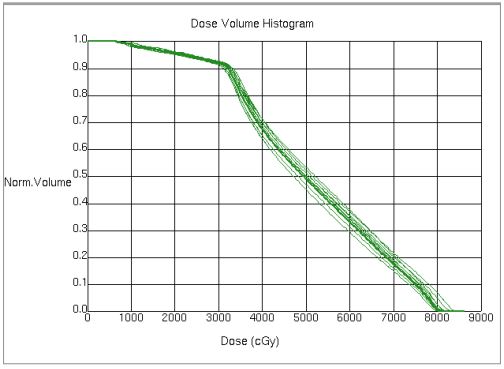
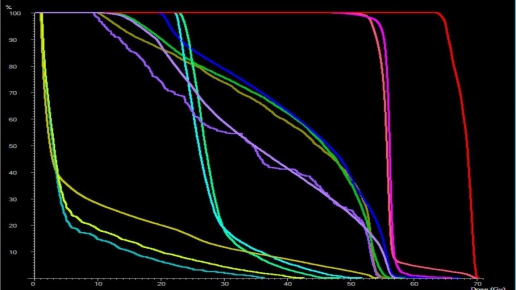
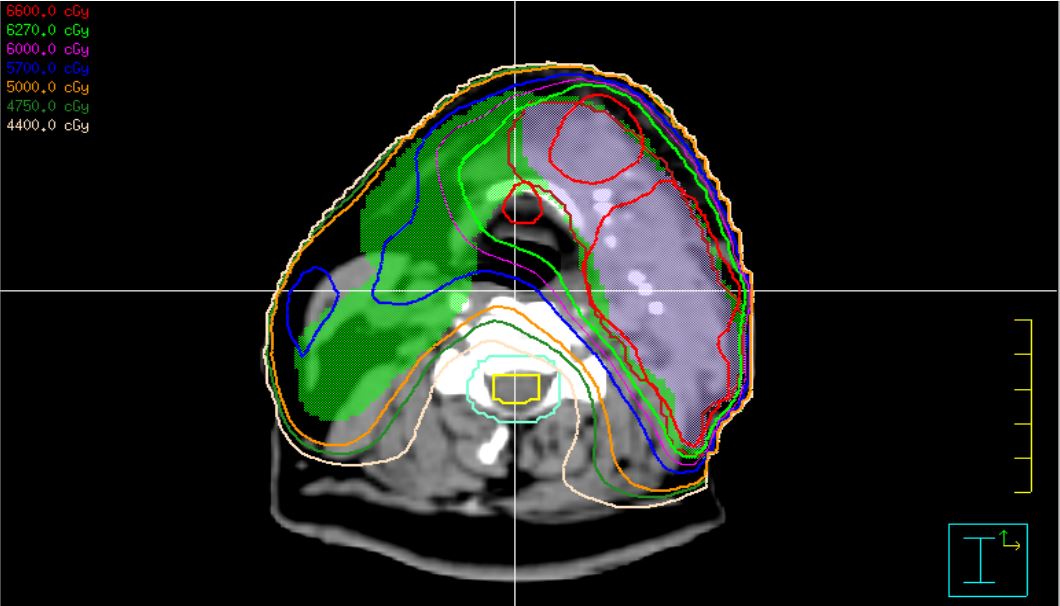
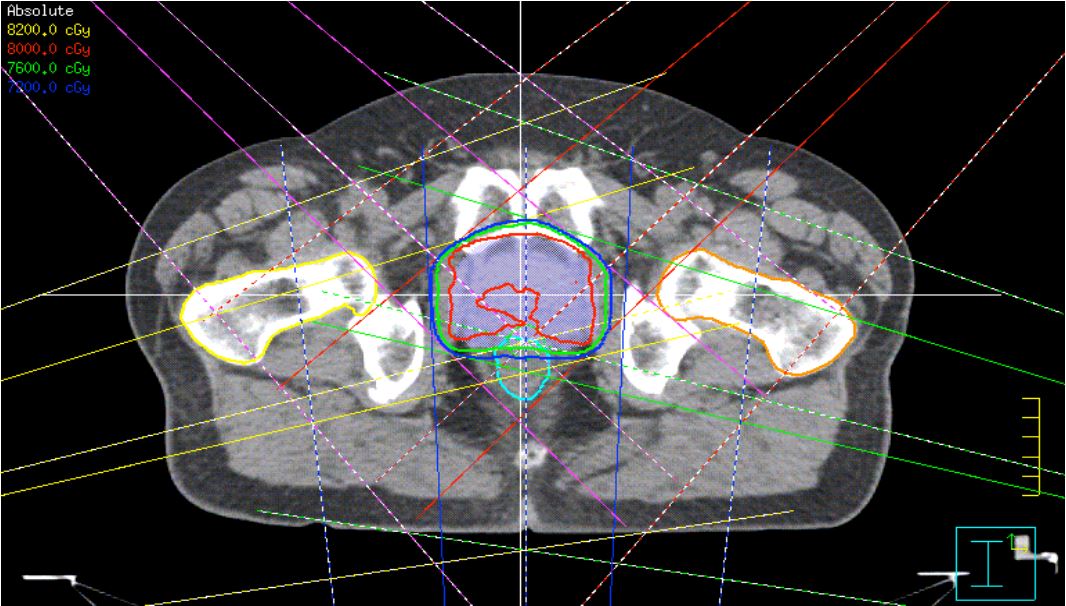
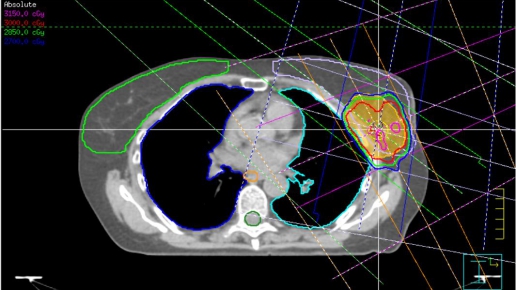
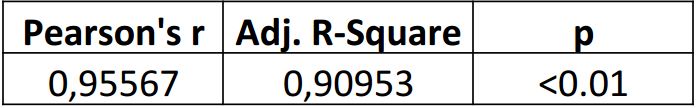
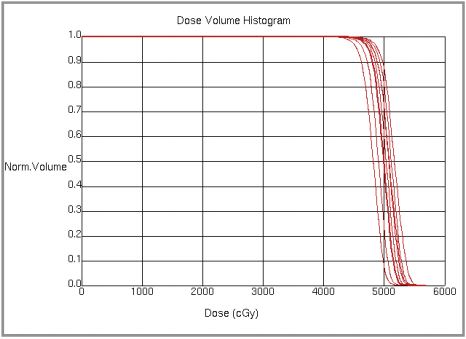
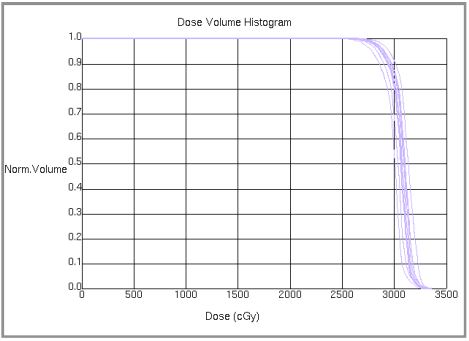
IQM signal correlation with PTV DVH
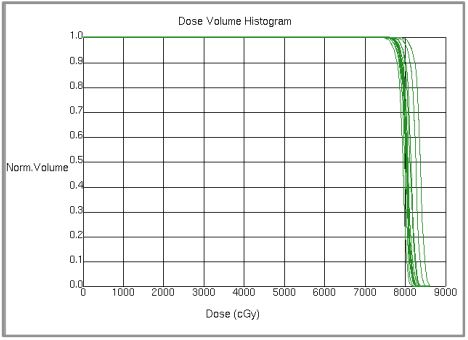
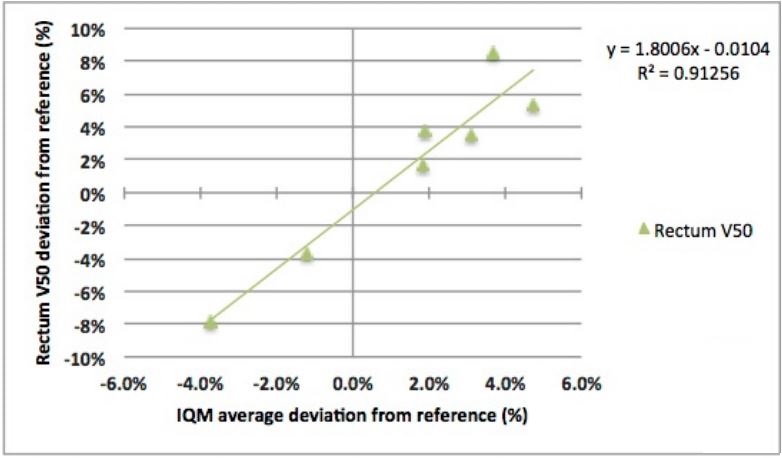
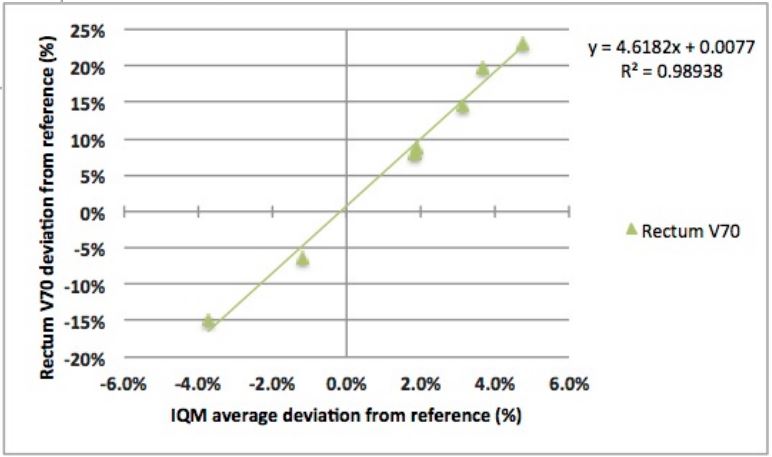
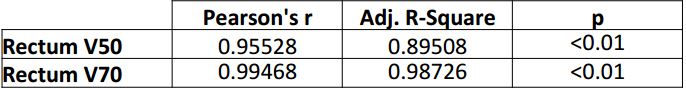
IQM signal correlation with OAR DVH (rectum in prostate case)