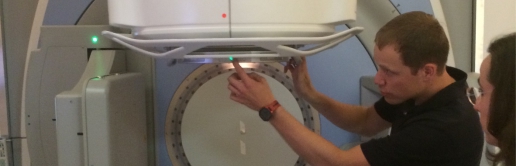
Error sensitivity for VMAT plans
Test method
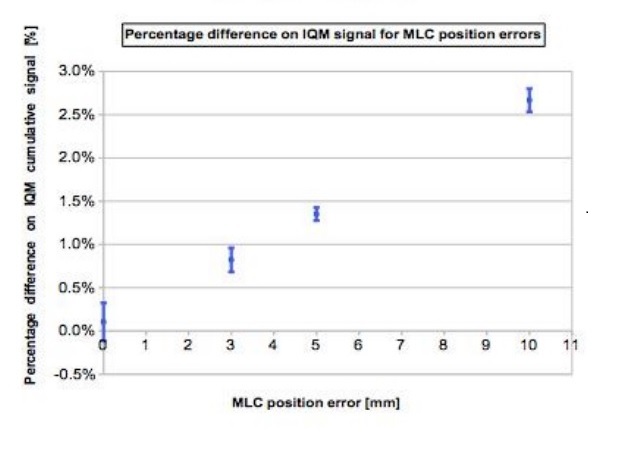
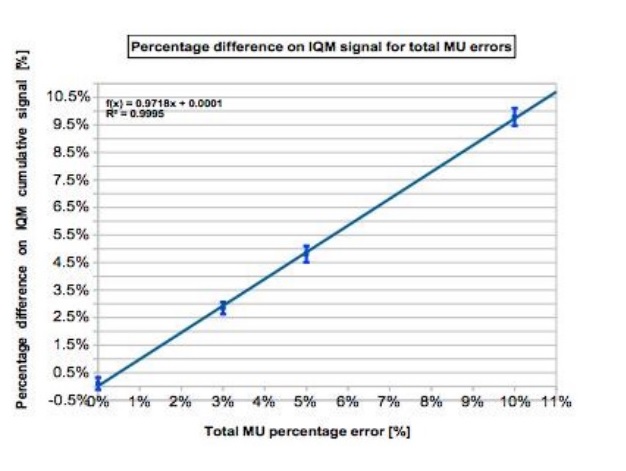
The IQM error sensitivity was evaluated by introducing deviations in 4 clinical H&N VMAT plans:
3, 5 and 10 % errors on total delivered MUs
and 3, 5 and 10 mm MLCs shift introduced with a Matlab script.
The cumulative IQM checksum value was measured and the percentage difference was calculated with respect to the non-modified plan.
Test results
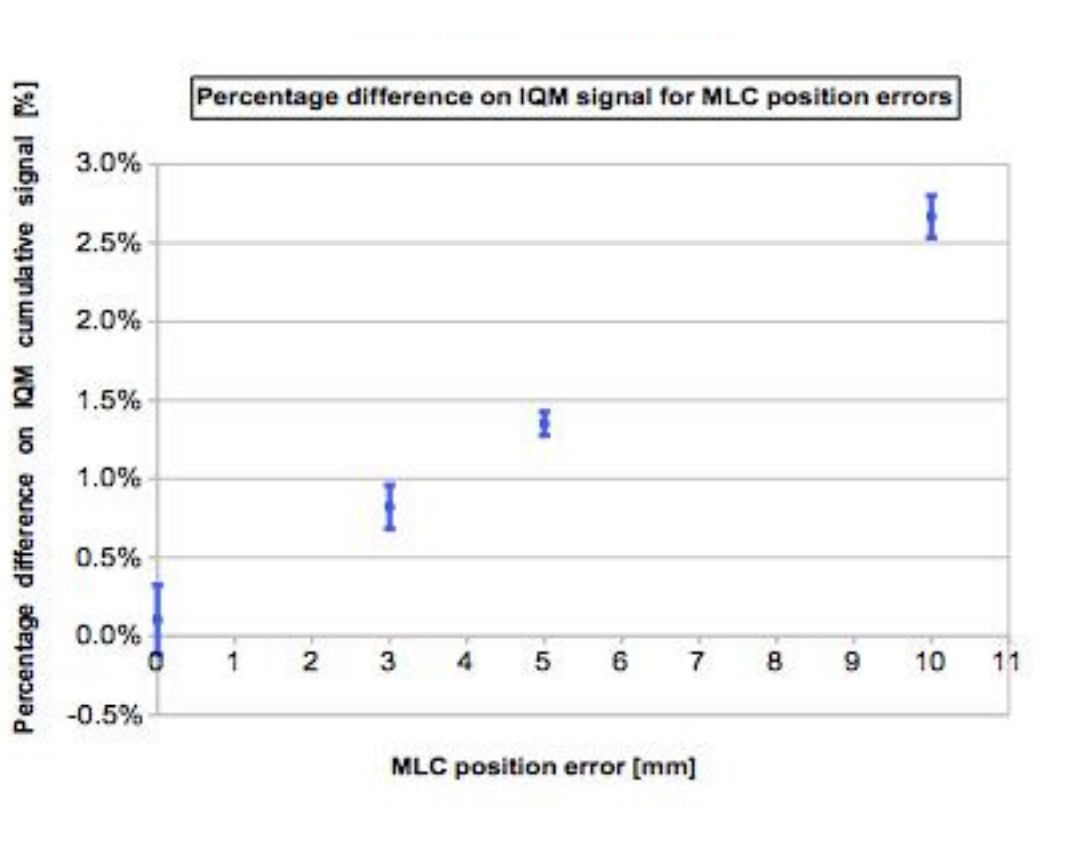
Both the MLC shift errors as well as the MU variations were detected by IQM.
IQM shows a linear response with dose (R2=0.9995).
Conclusion
IQM shows a good ability in detecting real-time errors and seems to be a good candidate to save time during the plan QA process.
The Beam Attenuation
of the IQM Detector
Test method
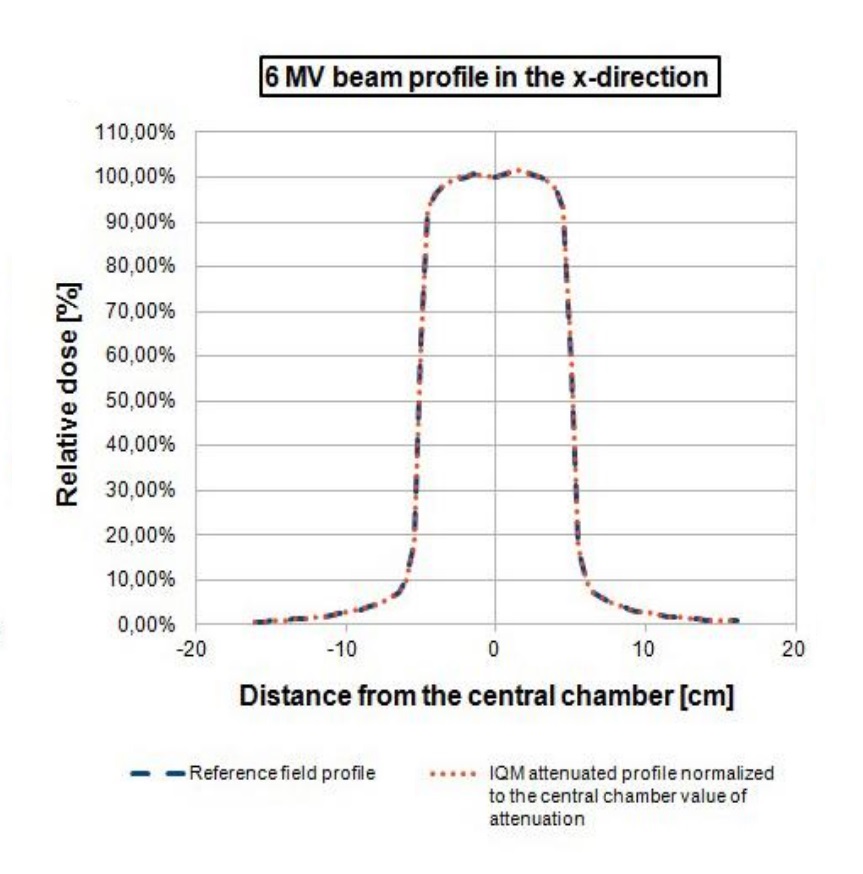
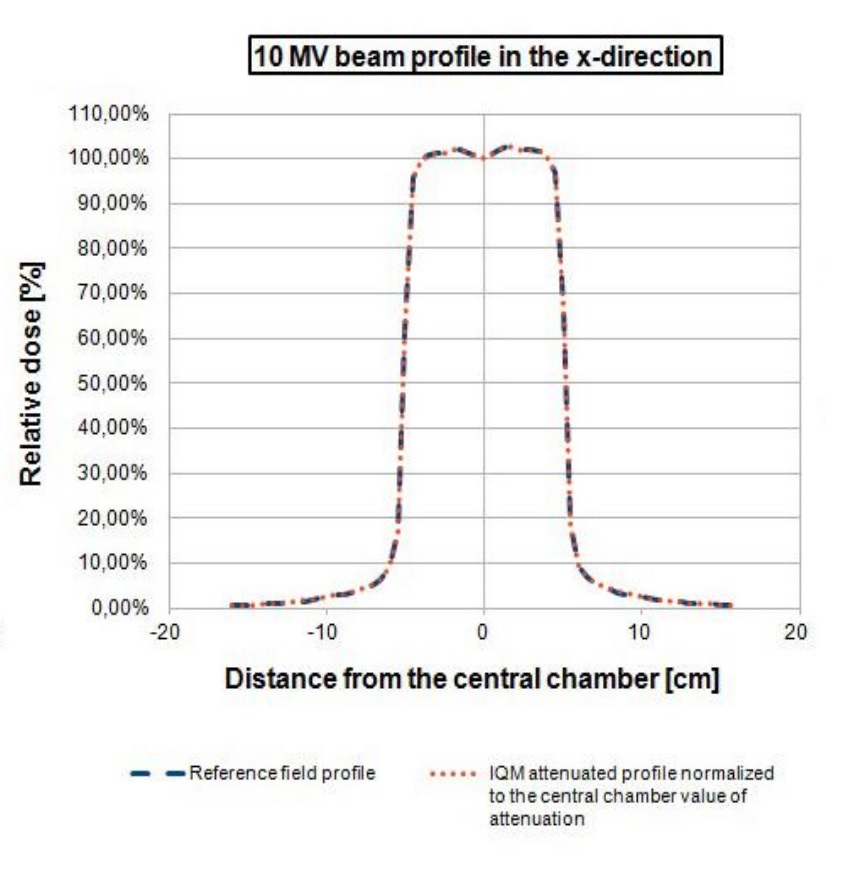
Beam attenuation was calculated at 4 different beam sizes (from 5 cm x 5 cm to 20cm x 20 cm) by the IC Profiler (Sun Nuclear Corp.) at 6 MV and 10 MV beam energies in both X and Y directions.
Test results
Beam attenuations were normalized to the central chamber of the IC Profiler. The average attenuation value was 6.56% ± 0.03% and 5.27% ± 0.12% for 6 MV and 10 MV beams, respectively. Flatness deviation is < 0.4 % for 6 MV and < 0.1 % for 10 MV excluding the beam penumbra regions. The beam profiles in the X direction for a 10 cm x 10 cm field are depicted in Figure 2 for 6 MV (Figure 2a) and 10 MV (Figure 2b) beams. The reference field profile (blue line) is plotted with the IQM attenuated field normalized to the central chamber attenuation value (orange line).
Conclusion
IQM beam attenuation can be considered to be homogeneous in both X and Y directions and the machine-specific beam attenuation percentage could be used to rescale treatment plan dose for clinical IQM use.
Comparing the error sensitivity of IQM with PTW Octavius 729
Test setup
A variety of treatment delivery errors were introduced into 4 clinical H&N VMAT plans.
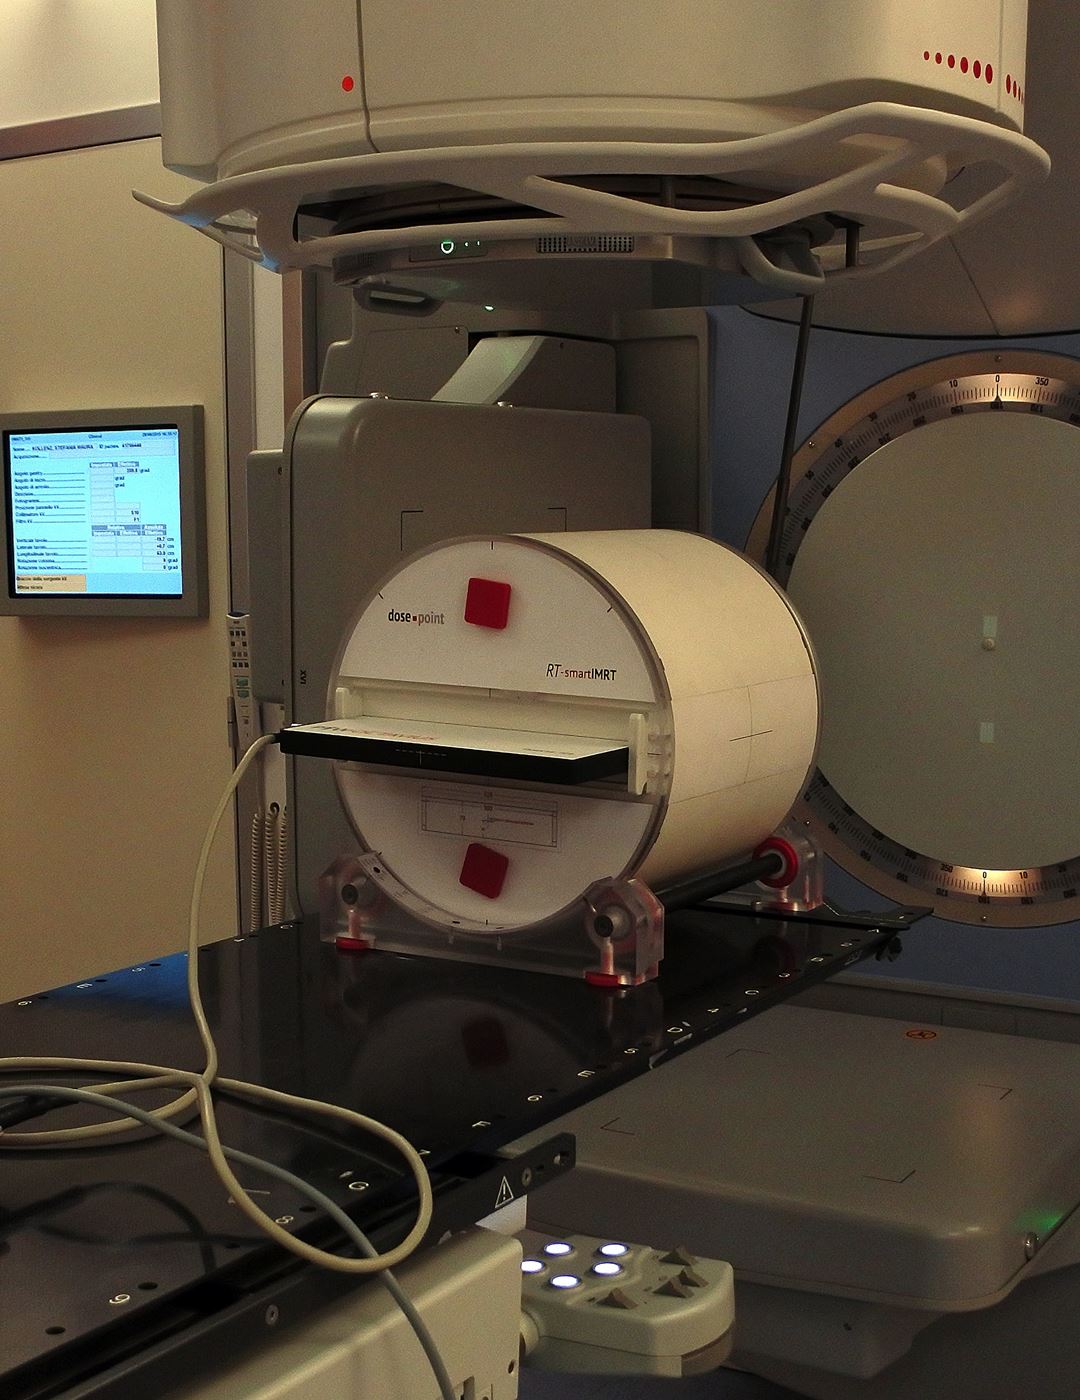
These plans were applied through the IQM onto a PTW Octavius 729 (local Gamma pass rate: 2%/2mm).
Which of the two systems will be able to detect the errors introduced into the VMAT delivery?
Test method
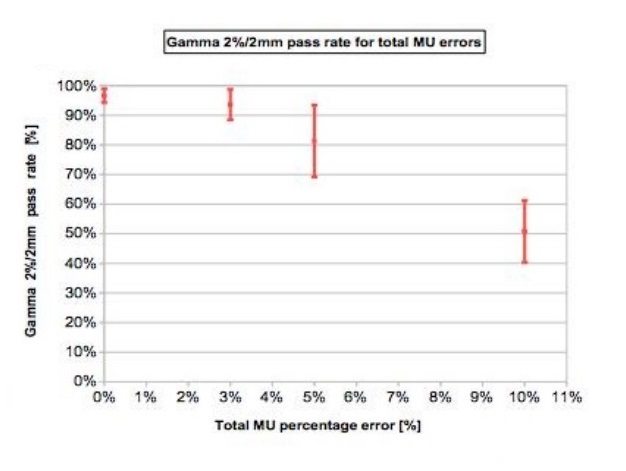
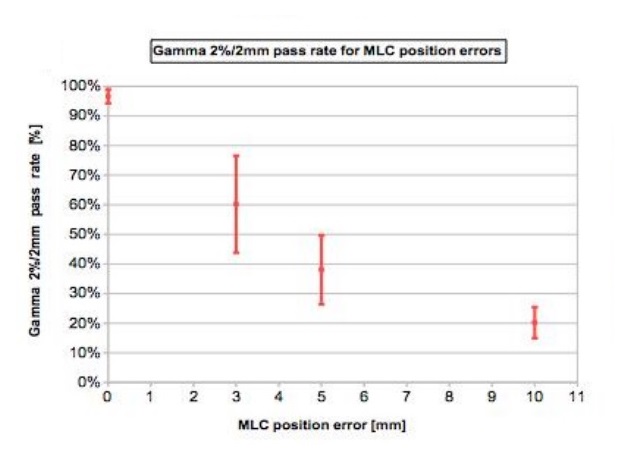
The errors introduced into the 4 H&N VMAT plans were 3, 5 and 10 % errors on total delivered MUs and with 3, 5 and 10 mm MLCs shift errors.
The cumulative IQM checksum value was measured and the percentage difference was calculated with respect to the non-modified plan. At the same time dose distribution maps were obtained through the PTW 2D array inserted in a rotating QA phantom (RT-smartIMRT, dose.point GmbH). The local gamma pass rates (2%/2 mm) were compared to the original plan values.
Test results
Both methods detect specifically MLC shift errors, while MU variations were better identified by IQM.
IQM shows a linear response with dose (R2=0.9995), while gamma analysis (as used by PTW Octavius) seems to have difficulty in identifying 3% and 5% MU variations.
Conclusion
IQM shows appreciable features in detecting real-time errors and promises considerable time-saving for QA measurements.
Signal linearity
Test purpose
The signal linearity test verifies that the signal detected by IQM is directly proportional to the dose output. If all other variables remain constant, the signal should double if the dose output is doubled.
Test method
The signal linearity test uses the reference field size of 10cm x 10cm
(defined by MLC and Jaws) for a 6MV photon beam. The dose output is increased through 8 measurements in the following steps:
2 MU / 5 MU / 10 MU / 20 MU / 50 MU / 100 MU / 200 MU / 500 MU
The coefficient of determination R2 indicates the variation of observed data from the line of best fit.
R2 is defined as:
1 − ??? ?? ??????? ???????? / ????? ??? ?? ???????
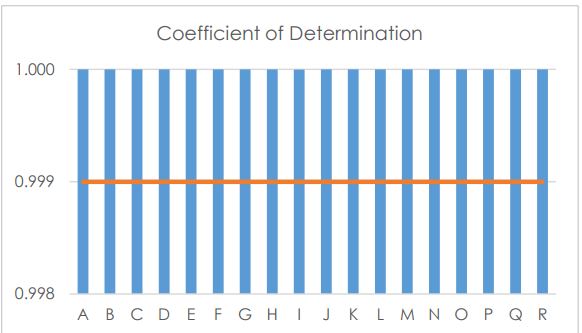
The signal linearity test passes if the R2 value is 0.999 or better for a linear fit equation (IQM signal vs. delivered MU).
Test measurements were performed on 18 linear accelerators.
Test results
The measured IQM Signal for all doses and the calculated coefficient of determination is listed in Table 1 and diagrammed in the Figure below with the pass criteria (orange line). Rounded to three decimal places, the R2 coefficient of determination is 1.000 for all linear accelerators, at all sites, passing the criteria of R2 at or better than 0.999.
Long-term signal reproducibility
Test purpose
This test verifies the IQM detector’s capability to measure the same signal when the same beam is repeated multiple times over a longer period.
Test method
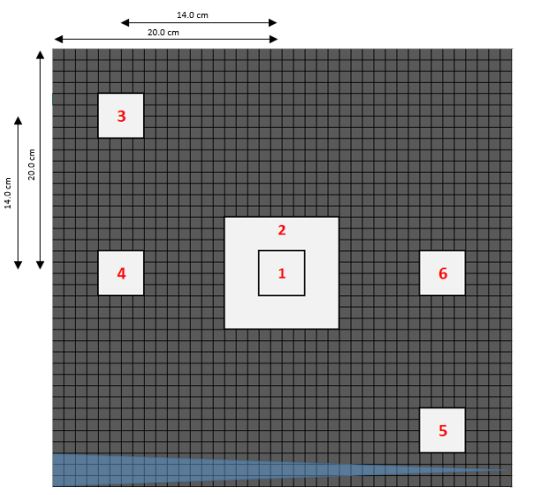
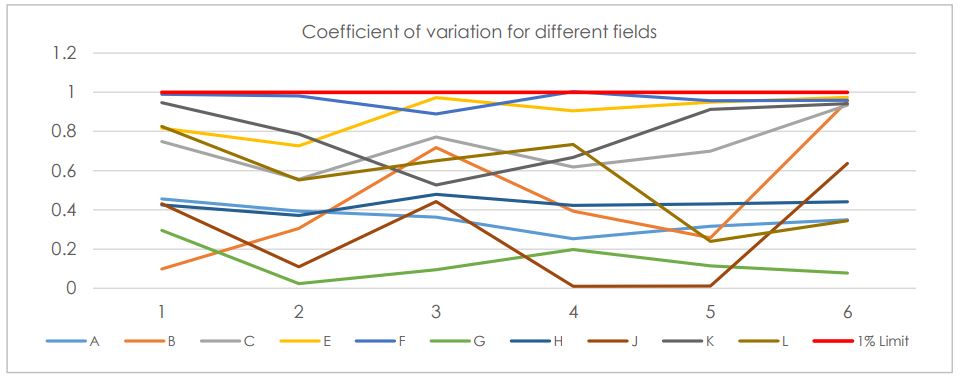
A group of 10 research partner sites ran six different fields for a 6MV photon beam delivering 100 MUs. The fields used are a centered 10 cm x 10 cm field and five 4 cm x 4 cm fields (defined by MLC and Jaws). The distribution of the segment openings is shown in the figure below. The fields were chosen to ensure the reproducibility of the signal for different field sizes and positions. Passing criteria for the test was that the variation of the measured signal for every beam segment be 1.00% or less. The research partners were asked to repeat the test on different days over a time period of multiple weeks. 10 beta test sites measured the fields on average 16.3 (2 – 59) times on 6.4 (1 – 19) different days.
Test results
The coefficient of variation for the selected fields varies from 0.01% to 0.99% and the mean variation ranges from 0.13% to 0.96%. For all sites the coefficient of variation is within the criteria of 1%. Figure 4 gives an overview of the variation. The results indicate a variation in the signal, which is due to Linac output variations on different days.
Conclusion
All measurements passed the acceptance criteria for reproducibility, with the
coefficient of variation being 1.00% or less. The results indicate high long term reproducibility.
Short-term signal reproducibility
Test purpose
The short-term signal reproducibility test verifies the IQM detector’s capability to measure the same signal when the same beam is repeated multiple times.
Test method
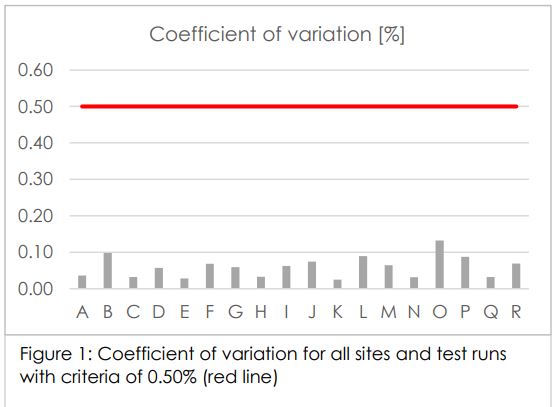
The signal reproducibility test uses the reference field size of 10 cm x 10 cm (defined by MLC and Jaws) for a 6MV photon beam delivering 100 MUs. The test is passed if the variation of the measured signal is 0.50% or less.
Test results
The coefficient of variation (%SD) varies for all sites from 0.03% to 0.13% and is diagrammed in the figure below.
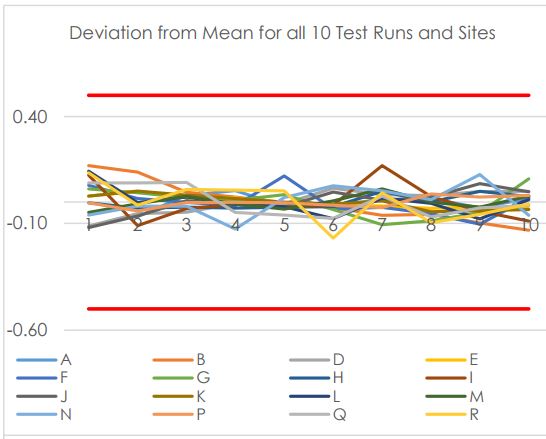
For further analysis the individual deviation from the average for every single test run was investigated. The same pass criteria as for the coefficient of variation (namely 0.50% or less) was applied for the deviation from mean. The results are shown in the figure below. The deviation from mean varies from 0.01% to 0.23% which indicates a small variation for the different test runs.
This is confirmed when inspecting the signal values for all 10 runs at all 18 linear accelerators /sites (in table 2 of the white paper). Within each site, test run results show minimal variation. This small variation is due to tolerances from the IQM (<+/- 0.50%) and slight Linac output variations.
Conclusion
Every IQM installed at each RT department passed the criteria for reproducibility, with a coefficient of variation under 0.50%. The results indicate a high reproducibility with low variation within all 10 test runs for each of the IQM systems installed.
Dose rate dependence test
Test purpose
The dose rate dependence test verifies that the IQM System measures the same signal for the same dose independent of the dose rate at which the dose is delivered.
Test method
The dose rate dependence test uses the reference field size of 10 cm x 10 cm (defined by MLC and Jaws) for a 6MV photon beam and a constant dose output of 100 MU. The test was performed for a number of dose rates as available at the specific Linear Accelerator, typically for the following dose rates:
20 MU/min / 50 MU/min / 100 MU/min / 200 MU/min / 400 MU/min / 600 MU/min / (for FFF beams the highest dose rate is also measured).
The pass criteria for the dose dependency test is that the variation between the signal at the highest dose rate and the signal measured at the other dose rates must be less than 0.5%.
Test results
Thirteen (13) of the 21 sites participated in the dose rate dependence test. Because many linear accelerators are limited to deliver only certain, pre-defined dose rates, certain sites have measured at only a few dose rates. Results at each site were normalized to the signal detected at the highest dose rate measured at that site.
The smallest variation with dose rate seen in our results is 0.00%, measured at Site A at 600 MU/min. The largest variation seen was 0.48%, measured at Site B at 50 MU/min. The mean variation over all sites at all dose rates was 0.19%.
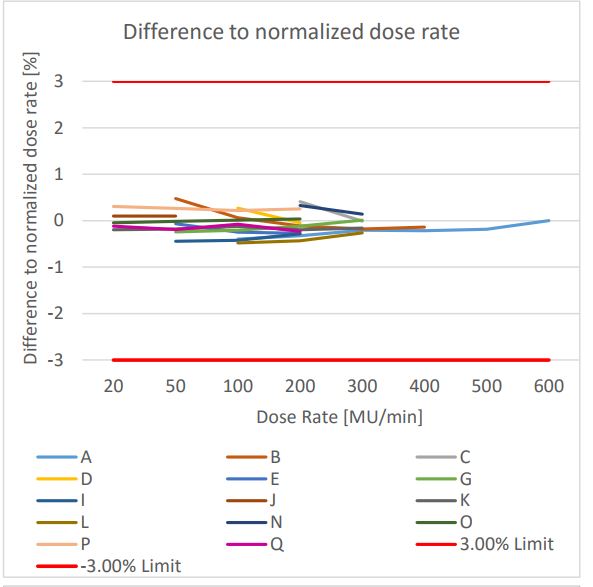
Conclusion
The IQM system measures dose independently from the dose rate at which the dose is delivered. The variation in the IQM Signal measured for a given dose delivered at different dose rates are well within our acceptance criteria of +/- 0.5%.
The dose rate dependence test, performed at 13 linear accelerators at research partner sites, confirmed that the IQM signal measured for a given dose does not depend on the dose rate at which that dose is delivered. IQM signal is virtually independent of dose rate.